Avon 2003 Annual Report Download - page 16
Download and view the complete annual report
Please find page 16 of the 2003 Avon annual report below. You can navigate through the pages in the report by either clicking on the pages listed below, or by using the keyword search tool below to find specific information within the annual report.-
 1
1 -
2
-
3
-
4
-
5
-
 6
6 -
 7
7 -
 8
8 -
 9
9 -
 10
10 -
 11
11 -
 12
12 -
 13
13 -
 14
14 -
 15
15 -
 16
16 -
 17
17 -
 18
18 -
 19
19 -
 20
20 -
 21
21 -
 22
22 -
 23
23 -
 24
24 -
 25
25 -
 26
26 -
27
-
28
-
29
-
30
-
31
-
32
-
33
-
34
-
35
-
36
-
37
-
38
-
39
-
40
-
41
-
42
-
43
-
44
-
45
-
46
-
47
-
48
-
49
-
50
-
51
-
52
-
53
-
54
-
55
-
56
-
57
-
58
-
59
-
60
-
61
-
62
-
63
-
64
-
65
-
66
-
67
-
68
-
69
-
70
-
71
-
72
-
73
-
74
-
75
-
76
-
77
-
78
-
79
-
80
-
81
-
82
-
83
-
84
-
85
 |
 |

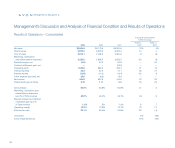
In 2003 Avon’s new brand for women, Mark, contributed to U.S.
sales growth, but the cost to launch the brand was one factor
negatively impacting U.S. operating margin.
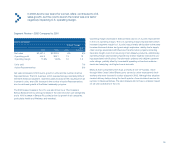
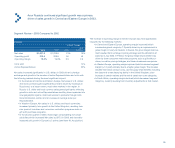
Segment Review – 2002 Compared to 2001
North America
%/Point Change
Local
2002 2001 US $ Currency
Net sales $2,457.4 $2,320.9 6% 6%
Operating profit 444.9 393.1 13 13
Operating margin 17.8% 16.8% 1.0 1.0
Units sold 7%
Active Representatives 3%
Net sales increased in 2002 due to growth in units and the number of active
Representatives. The U.S. business, which represented approximately 90% of
the North American segment, reported a sales increase of 6% resulting from an
increase in units, and a 3% increase in the number of active Representatives
due to continued growth of the Sales Leadership program.
The 2002 sales increase in the U.S. was also driven by a 7% increase in
Beauty Sales (driven by strong increases in the color and skin care categories)
and a 10% increase in Beauty Plus sales (driven by growth in all categories,
particularly Health and Wellness and watches).
Operating margin increased in 2002 primarily due to a 1.2 point improvement
in the U.S. operating margin. The U.S. operating margin improvement (which
increased segment margin by 1.0 point) was primarily attributable to the sales
increase discussed above, and gross margin expansion, mainly due to supply
chain savings associated with Business Transformation projects (including
favorable freight costs from sourcing of non-Beauty products). Additionally,
operating margin was favorably impacted by a lower expense ratio due to sav-
ings associated with Business Transformation projects and a higher customer
order charge, partially offset by incremental spending on brochure enhance-
ments and sampling, and higher bonus accruals.
Many of Avon’s shipments from Asia, primarily of non-CFT goods, move
through West Coast United States ports served by union-represented dock-
workers who were involved in a labor dispute in 2002. Although this situation
created delivery delays during the fourth quarter, Avon minimized service dis-
ruptions to Representatives. The labor dispute did not have a material impact
on full year operations in the U.S.
35