Avon 2003 Annual Report Download - page 19
Download and view the complete annual report
Please find page 19 of the 2003 Avon annual report below. You can navigate through the pages in the report by either clicking on the pages listed below, or by using the keyword search tool below to find specific information within the annual report.-
 1
1 -
2
-
3
-
4
-
5
-
6
-
7
-
8
-
 9
9 -
 10
10 -
 11
11 -
 12
12 -
 13
13 -
 14
14 -
 15
15 -
 16
16 -
 17
17 -
 18
18 -
 19
19 -
 20
20 -
 21
21 -
 22
22 -
 23
23 -
 24
24 -
 25
25 -
 26
26 -
 27
27 -
 28
28 -
 29
29 -
30
-
31
-
32
-
33
-
34
-
35
-
36
-
37
-
38
-
39
-
40
-
41
-
42
-
43
-
44
-
45
-
46
-
47
-
48
-
49
-
50
-
51
-
52
-
53
-
54
-
55
-
56
-
57
-
58
-
59
-
60
-
61
-
62
-
63
-
64
-
65
-
66
-
67
-
68
-
69
-
70
-
71
-
72
-
73
-
74
-
75
-
76
-
77
-
78
-
79
-
80
-
81
-
82
-
83
-
84
-
85
 |
 |
Management’s Discussion and Analysis of Financial Condition and Results of Operations
management’s discussion
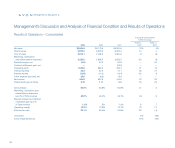
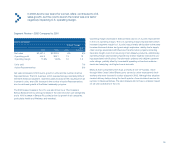
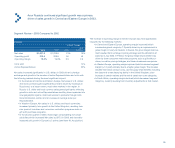
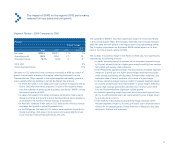
Segment Review – 2002 Compared to 2001
Latin America
%/Point Change
Local
2002 2001 US $ Currency
Net sales $1,654.9 $1,856.5 (11)% 12%
Operating profit 361.6 411.0 (12) 6
Operating margin 21.8% 22.1% (.3) (.3)
Units sold 9%
Active Representatives 9%
Net sales in U.S. dollars were significantly impacted by weaker foreign exchange
rates in most major markets. Excluding the impact of foreign currency exchange,
Net sales increased in 2002 with increases in all major markets in the region,
reflecting growth in units and active Representatives.
• In Argentina, Net sales in U.S. dollars decreased significantly due to the
negative impact of foreign exchange, but increased in local currency
despite the country’s economic and political issues, driven by growth in
active Representatives. Local management has taken numerous actions
to counter the challenges presented by this economic and political crisis.
• In Venezuela, Net sales in U.S. dollars decreased due to the negative
impact of foreign exchange, but increased significantly in local currency,
despite the country’s economic and political issues during 2002, bene-
fiting from inflationary price increases, new product launches and con-
sumer promotions.
• In Brazil, Net sales in U.S. dollars decreased due to the negative
impact of foreign exchange, but increased significantly in local cur-
rency, reflecting increases in units and active Representatives as well
as successful product launches.
• In Mexico, Net sales increased in U.S. dollars and local currency, bene-
fiting from new product launches with higher price points in non-CFT
product lines.
The decrease in operating margin in Latin America was most significantly
impacted by the following markets:
• In Argentina, operating margin decreased (which decreased segment
margin by .3 point) primarily due to an increase in the expense ratio. The
higher expense ratio was driven by an increase in the cost of imported
supplies resulting from the devaluation of the Argentine peso, as well as
increased sales incentives, sampling and higher banking taxes.
• In Central America, operating margin decreased (which decreased seg-
ment margin by .3 point) primarily due to an increase in the expense
ratio resulting from incremental marketing investments such as advertis-
ing, and additional bad debt expense.
Operating margin was favorably impacted by greater contributions from
countries with higher operating margins (which increased segment margin
by .4 point).
During 2002, the Brazilian real weakened as investor sentiment turned bear-
ish in the run up to the November presidential election. Investors were wor-
ried about the economic policies of the leading candidate from the Worker’s
Party. As predicted by the polls, the Worker’s Party candidate won the elec-
tion. Investors initially reacted negatively to the results. During 2003, investor
confidence, however, turned more favorable as the newly elected govern-
ment’s policies were more conservative than the market anticipated.
Argentina’s economic activity was severely depressed during 2002. This
resulted from the massive currency devaluation in early 2002 when the gov-
ernment allowed the peso to float freely after being pegged to the U.S. dollar
for over 10 years.
38