Avon 2003 Annual Report Download - page 23
Download and view the complete annual report
Please find page 23 of the 2003 Avon annual report below. You can navigate through the pages in the report by either clicking on the pages listed below, or by using the keyword search tool below to find specific information within the annual report.-
 1
1 -
2
-
3
-
4
-
5
-
6
-
7
-
8
-
9
-
10
-
11
-
12
-
 13
13 -
 14
14 -
 15
15 -
 16
16 -
 17
17 -
 18
18 -
 19
19 -
 20
20 -
 21
21 -
 22
22 -
 23
23 -
 24
24 -
 25
25 -
 26
26 -
 27
27 -
 28
28 -
 29
29 -
 30
30 -
 31
31 -
 32
32 -
 33
33 -
34
-
35
-
36
-
37
-
38
-
39
-
40
-
41
-
42
-
43
-
44
-
45
-
46
-
47
-
48
-
49
-
50
-
51
-
52
-
53
-
54
-
55
-
56
-
57
-
58
-
59
-
60
-
61
-
62
-
63
-
64
-
65
-
66
-
67
-
68
-
69
-
70
-
71
-
72
-
73
-
74
-
75
-
76
-
77
-
78
-
79
-
80
-
81
-
82
-
83
-
84
-
85
 |
 |
Management’s Discussion and Analysis of Financial Condition and Results of Operations
management’s discussion
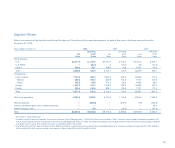
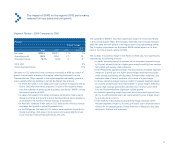
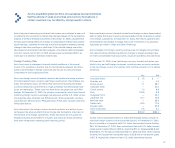
Segment Review – 2002 Compared to 2001
Pacific
%/Point Change
Local
2002 2001 US $ Currency
Net sales $829.7 $773.7 7% 8%
Operating profit 133.6 112.5 19 19
Operating margin 15.8% 14.3% 1.5 1.5
Units sold 19%
Active Representatives 6%
Net sales in U.S. dollars and local currency increased as a result of growth in
most major markets in the region, driven primarily by increases in units and
active Representatives.
• In China, Net sales in U.S. dollars and local currency increased primarily
due to a continued increase in the number of Avon beauty boutiques.
• In Japan, Net sales in U.S dollars were flat due to the negative impact of
foreign exchange and a weak economic environment, but increased in
local currency driven by an increase in active Representatives and
aggressive sales and merchandising programs.
• In the Philippines, Net sales in U.S. dollars were flat due to the negative
impact of foreign exchange, but increased in local currency due to an
increase in active Representatives, partially offset by the impact of the
depressed economic situation in the country.
The increase in operating margin in the Pacific was most significantly
impacted by the following markets:
• In China, operating margin improved (which increased segment margin
by 1.4 points) primarily due to a lower expense ratio resulting from oper-
ating expense leverage as this market achieves scale, partially offset by
incremental advertising expenses. Operating margin was negatively
impacted by a decline in gross margin resulting from aggressive pricing
and merchandising to increase market share.
• In Japan, operating margin improved (which increased segment margin
by .6 point) resulting primarily from gross margin expansion due to a
favorable mix of products sold and a lower expense ratio due to general
cost containment initiatives.
• In the Philippines, operating margin decreased (which decreased segment
margin by .5 point) due to a decrease in gross margin resulting from an
unfavorable mix of products sold, and a higher expense ratio due to
increased sales incentives, higher bad debt expense and incremental
spending on sampling.
Global Expenses
Global expenses increased $14.2 in 2003 primarily due to expenses of $6.5
related to Avon’s supply chain initiatives; incremental investments of $5.8 for
global marketing and research and development; higher pension expense of
$5.4; higher legal expenses of $4.7; higher professional service fees of $3.6;
and higher expenses of $2.8 resulting from higher charitable contributions to
the Avon Foundation; partially offset by lower bonus accruals of $12.6 and
higher net gains of $3.4 in 2003 on Company-owned life insurance policies.
Global expenses increased $3.2 in 2002 primarily due to incremental invest-
ments of $12.2 for research and development and global marketing, as well as
a new Teen product line called Mark. (which launched in late 2003), higher bonus
accruals of $9.2, merit salary increases of approximately $4.0, and severance
accruals of $3.1 for employees not included in the 2002 Special charges. These
increases were partially offset by net savings of approximately $23.0 from work-
force reductions associated with Avon’s Business Transformation initiatives.
42