Avon 2003 Annual Report Download - page 61
Download and view the complete annual report
Please find page 61 of the 2003 Avon annual report below. You can navigate through the pages in the report by either clicking on the pages listed below, or by using the keyword search tool below to find specific information within the annual report.-
 1
1 -
2
-
3
-
4
-
5
-
6
-
7
-
8
-
9
-
10
-
11
-
12
-
13
-
14
-
15
-
16
-
17
-
18
-
19
-
20
-
21
-
22
-
23
-
24
-
25
-
26
-
27
-
28
-
29
-
30
-
31
-
32
-
33
-
34
-
35
-
36
-
37
-
38
-
39
-
40
-
41
-
42
-
43
-
44
-
45
-
46
-
47
-
48
-
49
-
50
-
 51
51 -
 52
52 -
 53
53 -
 54
54 -
 55
55 -
 56
56 -
 57
57 -
 58
58 -
 59
59 -
 60
60 -
 61
61 -
 62
62 -
 63
63 -
 64
64 -
 65
65 -
 66
66 -
 67
67 -
 68
68 -
 69
69 -
 70
70 -
 71
71 -
72
-
73
-
74
-
75
-
76
-
77
-
78
-
79
-
80
-
81
-
82
-
83
-
84
-
85
 |
 |

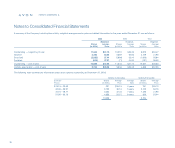
The U.S. pension plans include funded qualified plans and unfunded non-qualified plans. As of December 31, 2003 and 2002, the U.S. qualified pension plans
had benefit obligations of $611.5 and $575.6, and plan assets of $547.7 and $475.8, respectively. Avon believes it has adequate investments and cash flows to
fund the liabilities associated with the unfunded non-qualified plans.
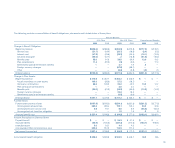
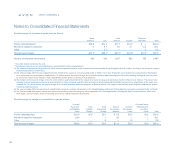
The projected benefit obligation, accumulated benefit obligation and fair value of plan assets for pension benefit plans with accumulated benefit obligations in
excess of plan assets as of December 31, 2003 and 2002, were as follows:
Pension Benefits
U.S. Plans Non-U.S. Plans
2003 2002 2003 2002
Projected benefit obligation $705.5 $659.0 $485.1 $412.5
Accumulated benefit obligation 629.0 605.8 452.8 385.6
Fair value plan assets 547.7 475.8 220.2 173.5
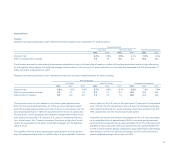
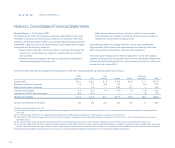
Net Periodic Benefit Cost
Net periodic benefit cost for the years ended December 31 was determined as follows:
Pension Benefits
U.S. Plans Non-U.S. Plans Postretirement Benefits
2003 2002 2001 2003 2002 2001 2003 2002 2001
Service cost $ 21.7 $ 19.0 $ 18.7 $ 20.7 $ 18.8 $ 15.6 $ 2.4 $ 2.2 $ 1.2
Interest cost 47.2 43.6 41.9 30.3 25.4 23.3 12.1 12.5 10.7
Expected return on plan assets (52.3) (53.2) (49.3) (22.9) (20.9) (18.8) —— —
Amortization of transition liability —— — .8 .5 .2 — — —
Amortization of prior service cost 1.9 1.5 (.1) 3.5 1.4 1.1 (5.0) (4.1) (3.9)
Amortization of actuarial losses (gains) 18.9 1.4 2.3 6.0 2.8 1.7 1.8 .7 (.3)
Settlements or curtailments — — 2.5 (.1) 2.6 — (.1) — (2.1)
Special termination benefits — — 9.4 .7 — — — — .7
Other —— — (1.4) (1.0) (1.1) —— —
Net periodic benefit cost $ 37.4 $ 12.3 $ 25.4 $ 37.6 $ 29.6 $ 22.0 $11.2 $11.3 $ 6.3
Notes to Consolidated Financial Statements
notes to statements
80
In 2002 and 2001, the plan assets experienced weaker investment returns,
which was mostly due to unfavorable returns on equity securities. These unfa-
vorable investment returns increased pension costs in 2003 and will increase
pension costs in 2004. In addition, net periodic pension cost may significantly
increase in the future if settlement losses are required to be recorded due to an
increase in the aggregate benefits paid as lump sum distributions. Settlement
losses may result in the future if the number of eligible participants deciding to
receive lump sum distributions and the amount of their benefits increases.
Special termination benefits and settlements or curtailments primarily repre-
sent the impact of employee terminations on the Company’s benefits plans in
the U.S. and certain international locations (see Note 13, Special Charges).