Avon 2003 Annual Report Download - page 20
Download and view the complete annual report
Please find page 20 of the 2003 Avon annual report below. You can navigate through the pages in the report by either clicking on the pages listed below, or by using the keyword search tool below to find specific information within the annual report.-
 1
1 -
2
-
3
-
4
-
5
-
6
-
7
-
8
-
9
-
 10
10 -
 11
11 -
 12
12 -
 13
13 -
 14
14 -
 15
15 -
 16
16 -
 17
17 -
 18
18 -
 19
19 -
 20
20 -
 21
21 -
 22
22 -
 23
23 -
 24
24 -
 25
25 -
 26
26 -
 27
27 -
 28
28 -
 29
29 -
 30
30 -
31
-
32
-
33
-
34
-
35
-
36
-
37
-
38
-
39
-
40
-
41
-
42
-
43
-
44
-
45
-
46
-
47
-
48
-
49
-
50
-
51
-
52
-
53
-
54
-
55
-
56
-
57
-
58
-
59
-
60
-
61
-
62
-
63
-
64
-
65
-
66
-
67
-
68
-
69
-
70
-
71
-
72
-
73
-
74
-
75
-
76
-
77
-
78
-
79
-
80
-
81
-
82
-
83
-
84
-
85
 |
 |

Avon Russia’s continued significant growth was a primary
driver of sales growth in Central and Eastern Europe in 2003.
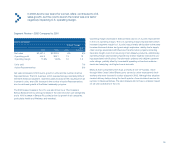
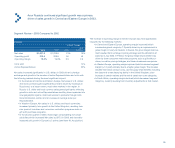
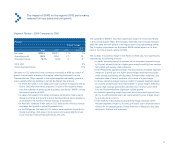
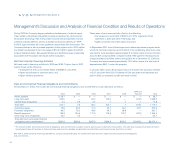
Segment Review – 2003 Compared to 2002
Europe
%/Point Change
Local
2003 2002 US $ Currency
Net sales $1,607.2 $1,228.6 31% 19%
Operating profit 313.4 208.8 50 40
Operating margin 19.4% 16.9% 2.5 2.5
Units sold 14%
Active Representatives 20%
Net sales increased significantly in U.S. dollars in 2003 driven by foreign
exchange and growth in the number of active Representatives and units with
the following markets having the most significant impact:
• In the markets of Central and Eastern Europe, Net sales in U.S. dollars
and local currencies grew significantly primarily driven by increases in
Russia and, to a lesser extent, most other markets in the region. In
Russia, U.S. dollar and local currency sales grew significantly reflecting
growth in units and active Representatives resulting from expansion into
new geographic regions, improved access to products through addi-
tional distribution centers and an increase in average order per
Representative.
• In Western Europe, Net sales in U.S. dollars and local currencies
increased primarily from growth in the United Kingdom, resulting from
new product launches and consumer motivation programs such as
gift with purchase programs.
• In the second quarter of 2003, Avon began consolidating its Turkish
subsidiary which increased Net sales by $47.2 in 2003, and favorably
impacted unit growth in Europe by 2 points (see Note 18, Acquisition).
The increase in operating margin in 2003 in Europe was most significantly
impacted by the following markets:
• In Central and Eastern Europe, operating margin improved (which
increased segment margin by 1.3 points) driven by an improvement in
gross margin in nearly all markets. In Russia, the gross margin improve-
ment resulted from a change in pricing strategy and the elimination of
sales tax in July 2003. In Poland, the gross margin improvement was
driven by lower consumer motivation programs such as gift with pur-
chase, as well as pricing strategies, and lower obsolescence expense.
• In Western Europe, operating margin improved (which increased segment
margin by 1.0 point) primarily due to a higher gross margin. This increase
resulted from lower product costs, due to supply chain benefits including
the closure of a manufacturing facility in the United Kingdom, price
increases in certain markets and the exit of certain non-core categories.
• In South Africa, operating margin declined (which decreased segment
margin by .6 point) resulting from inventory adjustments in that market.
39