Avon 2003 Annual Report Download - page 10
Download and view the complete annual report
Please find page 10 of the 2003 Avon annual report below. You can navigate through the pages in the report by either clicking on the pages listed below, or by using the keyword search tool below to find specific information within the annual report.-
 1
1 -
 2
2 -
 3
3 -
 4
4 -
 5
5 -
 6
6 -
 7
7 -
 8
8 -
 9
9 -
 10
10 -
 11
11 -
 12
12 -
 13
13 -
 14
14 -
 15
15 -
 16
16 -
 17
17 -
 18
18 -
 19
19 -
 20
20 -
 21
21 -
22
-
23
-
24
-
25
-
26
-
27
-
28
-
29
-
30
-
31
-
32
-
33
-
34
-
35
-
36
-
37
-
38
-
39
-
40
-
41
-
42
-
43
-
44
-
45
-
46
-
47
-
48
-
49
-
50
-
51
-
52
-
53
-
54
-
55
-
56
-
57
-
58
-
59
-
60
-
61
-
62
-
63
-
64
-
65
-
66
-
67
-
68
-
69
-
70
-
71
-
72
-
73
-
74
-
75
-
76
-
77
-
78
-
79
-
80
-
81
-
82
-
83
-
84
-
85
 |
 |

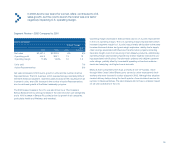
Sales of Beauty products grew 15% in 2003, including strong increases
in the skin care, fragrance, color and personal care categories.
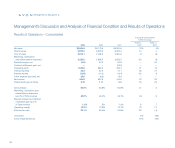
Net Sales
Net sales growth in 2003 of 10% in U.S. dollars was driven by an increase in
the number of active Representatives and, to a lesser extent, growth in units,
with dollar increases in all regions. The rate of unit growth was lower in 2003
versus 2002 driven primarily by a shift in mix to higher priced products.
Additionally, in the second quarter of 2003, Avon began consolidating its
Turkish subsidiary which increased sales by $47.2 in 2003. Excluding the
impact of foreign currency exchange, consolidated Net sales also increased
10%, with increases in all regions.
The 2003 Net sales increase was also driven by a 15% increase in Beauty
sales (including strong increases in the skin care, fragrance, color and per-
sonal care categories) and, to a lesser extent, increases in Beyond Beauty sales
of 3% (including a strong increase in Health and Wellness sales within this
category) and Beauty Plus sales of 2%.
Net sales growth in 2002 was driven by an increase in units and the number
of active Representatives, with dollar increases in all regions except Latin
America, which was negatively impacted by weaker foreign exchange rates
resulting from economic and political uncertainties in the region. Excluding the
impact of foreign currency exchange, consolidated Net sales increased 11%,
with increases in all regions.
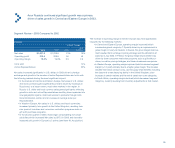
Other Revenue
Other revenue primarily includes shipping and handling fees billed to
Representatives, which totaled $71.4, $57.7 and $42.5 in 2003, 2002 and
2001, respectively.
Gross Margin
Gross margin improved in 2003 due to increases in all regions as follows:
Europe (1.6 points, which increased consolidated gross margin by .4 point),
Latin America (1.1 points, which increased consolidated gross margin by
.3 point), the Pacific (2.1 points, which increased consolidated gross margin
by .3 point) and North America (.1 point, which increased consolidated gross
margin by .1 point). Additionally, gross margin benefited from greater contribu-
tions from countries with higher gross margins (which increased consolidated
gross margin by .1 point). The gross margin improvements discussed previously
include net savings associated with supply chain Business Transformation ini-
tiatives across all segments, which favorably impacted consolidated gross mar-
gin by 1.3 points.
Gross margin improved in 2002 due to an increase in North America (1.0 point,
which increased consolidated gross margin by .4 point), partially offset by a
decrease in Europe (1.2 points, which reduced consolidated gross margin by
.2 point). Gross margin in Latin America and the Pacific were flat. The gross
margin improvements discussed previously include net savings across all
geographic segments associated with supply chain Business Transformation
initiatives, which favorably impacted consolidated gross margin by .5 point.
Gross margins in 2002 and 2001 included $2.0 and $2.5, respectively, of
charges related to inventory write-downs, which were included in the Special
charges (see Note 13, Special Charges).
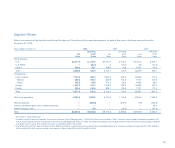
See the “Segment Review” sections of Management’s Discussion and Analysis
of Financial Condition and Results of Operations for additional information
related to changes in gross margin by segment.
Marketing, Distribution and Administrative Expenses
Marketing, distribution and administrative expenses increased $332.0 in 2003
primarily due to a 10% sales increase (which resulted in an increase in expenses
of approximately $162.0), an increase in consumer and strategic investments of
$94.0 (including spending on the brochure and Sales Leadership), an increase in
marketing expenses of $58.2 (including direct marketing, customer access and
public relations), higher customer service costs in the U.S. of approximately
$25.0, merit salary increases of approximately $24.0 for certain marketing, distri-
bution and administrative personnel around the world, an increase in domestic
pension expense of approximately $23.0, expenses of $19.5 related to Avon’s
29