Avon 2003 Annual Report Download - page 66
Download and view the complete annual report
Please find page 66 of the 2003 Avon annual report below. You can navigate through the pages in the report by either clicking on the pages listed below, or by using the keyword search tool below to find specific information within the annual report.-
 1
1 -
2
-
3
-
4
-
5
-
6
-
7
-
8
-
9
-
10
-
11
-
12
-
13
-
14
-
15
-
16
-
17
-
18
-
19
-
20
-
21
-
22
-
23
-
24
-
25
-
26
-
27
-
28
-
29
-
30
-
31
-
32
-
33
-
34
-
35
-
36
-
37
-
38
-
39
-
40
-
41
-
42
-
43
-
44
-
45
-
46
-
47
-
48
-
49
-
50
-
51
-
52
-
53
-
54
-
55
-
 56
56 -
 57
57 -
 58
58 -
 59
59 -
 60
60 -
 61
61 -
 62
62 -
 63
63 -
 64
64 -
 65
65 -
 66
66 -
 67
67 -
 68
68 -
 69
69 -
 70
70 -
 71
71 -
 72
72 -
 73
73 -
 74
74 -
 75
75 -
 76
76 -
77
-
78
-
79
-
80
-
81
-
82
-
83
-
84
-
85
 |
 |

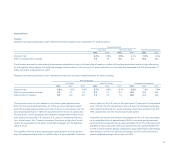
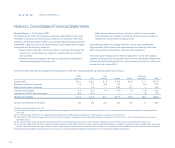
geographic location. Intersegment sales and transfers are not significant.
Each segment records direct expenses related to its employees and its opera-
tions. The Company does not allocate income taxes, foreign exchange gains
or losses, or corporate global expenses to operating segments.
Effective July 2002, Avon consolidated the management of its two Latin
American operating business units into one Latin American operating busi-
ness unit and, therefore, Latin America is presented as one business unit
for segment reporting purposes. Effective January 1, 2003, the Dominican
Republic was included in North America whereas in prior years it had been
included in Latin America. Effective July 1, 2003, Avon Centre was included
in North America – Other, whereas in prior periods it had been included in
U.S. Retail (see Note 17, Other Information, regarding the U.S. Retail busi-
ness). Prior year amounts have been reclassified to conform to the current
period presentation.
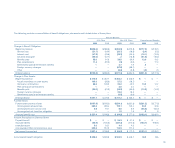
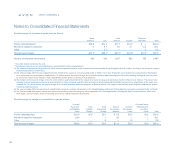
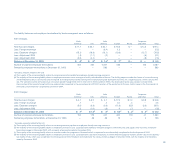
Summarized financial information concerning Avon’s reportable segments
as of December 31 is shown in the following tables. In the following tables,
North America – Other includes Canada, the Dominican Republic, Puerto
Rico and Avon Centre.
85
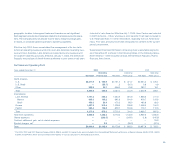
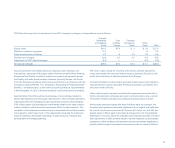
Net Sales and Operating Profit
Years ended December 31 2003 2002 2001
Operating Operating Operating
Net Sales Profit (Loss) Net Sales Profit (Loss) Net Sales Profit (Loss)
North America
U.S. $2,217.9 $ 420.9 $2,151.2 $ 421.2 $2,024.2 $ 370.1
U.S. Retail — (20.7) .2 (20.1) 3.6 4.9
Other 308.9 25.7 306.0 43.8 293.1 18.1
Total 2,526.8 425.9 2,457.4 444.9 2,320.9 393.1
International
Latin America 1,747.2 406.3 1,654.9 361.6 1,856.5 411.0
Mexico 669.3 190.2 661.8 164.6 619.7 154.6
Brazil 489.3 93.4 472.5 98.3 485.8 98.0
Europe 1,607.2 313.4 1,228.6 208.8 1,008.5 164.0
Pacific 923.4 156.6 829.7 133.6 773.7 112.5
Total 4,277.8 876.3 3,713.2 704.0 3,638.7 687.5
Total from operations 6,804.6 1,302.2 6,170.6 1,148.9 5,959.6 1,080.6
Global expenses — (263.3) — (249.1) (1.8) (245.9)
Contract settlement gain, net of related expenses — — — — — 25.9
Special charges, net* — 3.9 — (36.3) — (97.4)
Total $6,804.6 $1,042.8 $6,170.6 $ 863.5 $5,957.8 $ 763.2
* The 2003, 2002 and 2001 Special charges of $3.9, ($36.3) and ($97.4), respectively, were included in the Consolidated Statements of Income as Special charges ($3.9 in 2003, ($34.3)
in 2002 and ($94.9) in 2001) and as inventory write-downs in Cost of sales ($2.0 in 2002 and $2.5 in 2001).