Avon 2003 Annual Report Download - page 15
Download and view the complete annual report
Please find page 15 of the 2003 Avon annual report below. You can navigate through the pages in the report by either clicking on the pages listed below, or by using the keyword search tool below to find specific information within the annual report.-
 1
1 -
2
-
3
-
4
-
 5
5 -
 6
6 -
 7
7 -
 8
8 -
 9
9 -
 10
10 -
 11
11 -
 12
12 -
 13
13 -
 14
14 -
 15
15 -
 16
16 -
 17
17 -
 18
18 -
 19
19 -
 20
20 -
 21
21 -
 22
22 -
 23
23 -
 24
24 -
 25
25 -
26
-
27
-
28
-
29
-
30
-
31
-
32
-
33
-
34
-
35
-
36
-
37
-
38
-
39
-
40
-
41
-
42
-
43
-
44
-
45
-
46
-
47
-
48
-
49
-
50
-
51
-
52
-
53
-
54
-
55
-
56
-
57
-
58
-
59
-
60
-
61
-
62
-
63
-
64
-
65
-
66
-
67
-
68
-
69
-
70
-
71
-
72
-
73
-
74
-
75
-
76
-
77
-
78
-
79
-
80
-
81
-
82
-
83
-
84
-
85
 |
 |

Management’s Discussion and Analysis of Financial Condition and Results of Operations
management’s discussion
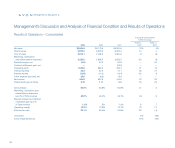
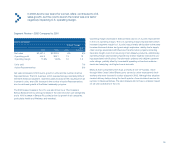
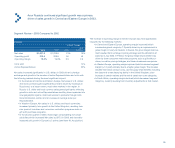
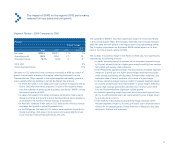
Segment Review – 2003 Compared to 2002
North America
%/Point Change
Local
2003 2002 US $ Currency
Net sales $2,526.8 $2,457.4 3% 3%
Operating profit 425.9 444.9 (4) (4)
Operating margin 16.5% 17.8% (1.3) (1.3)
Units sold 2%
Active Representatives 3%
The U.S. business, which represents approximately 90% of the North
American segment, reported a sales increase of 3% in 2003 resulting from
a higher number of active Representatives (reflecting growth of the Sales
Leadership program), increases in units and successful new product launches
including Mark.
On a category basis, the 2003 sales increase in the U.S. was driven by a 9%
increase in Beauty sales (reflecting strong increases in the skin care and per-
sonal care categories, partially offset by a decline in fragrance). That increase
was largely offset by a 4% decline in Beyond Beauty sales and a 1% decline
in Beauty Plus sales, reflecting a strategic de-emphasis of toys, severe snow-
storms and the impact of the war in Iraq on consumer spending in the first
half of 2003, as well as a temporary inability to fill demand for certain holiday
non-beauty products in the fourth quarter of 2003.
The decrease in operating margin in North America in 2003 was most signifi-
cantly impacted by the following markets:
• In the U.S., operating margin declined (which decreased segment
margin by .6 point) primarily due to an unfavorable expense ratio. The
unfavorable expense ratio was driven by incremental consumer and
strategic spending in support of Mark. as well as increased advertising.
In addition, higher customer service expenses and higher pension-
related costs were partially offset by lower bonus accruals and a higher
customer order charge. The unfavorable expense ratio was partially off-
set by an improvement in gross margin mainly due to a favorable mix of
products sold and savings resulting from supply chain initiatives associ-
ated with Business Transformation.
• In the Dominican Republic, operating margin declined (which decreased
segment margin by .4 point) as a result of a sales decline resulting from
the factors discussed below.
• In Canada, operating margin declined (which decreased segment mar-
gin by .3 point) primarily due to an unfavorable expense ratio resulting
from expenses associated with Business Transformation initiatives,
higher pension costs and incremental spending on the brochure.
• Operating margin for the U.S. Retail business was flat in 2003 resulting
from costs of $18.3 in 2003 associated with the repositioning of the
beComing line of products (see Note 17, Other Information), offset by
operating losses in 2002, which were not repeated in 2003 due to the
repositioning of the beComing brand.
The Dominican peso devalued by approximately 49% in 2003 as a result of a
shortage of hard currency. The International Monetary Fund (“IMF”) has negoti-
ated a financial assistance package with the Dominican government; however,
the government is having difficulty in reaching the IMF targets as the economy
continues in crisis. As a result of this crisis and local operational weakness, the
U.S. dollar results of Avon’s business in the Dominican Republic were nega-
tively impacted in 2003. In 2003, the Dominican Republic represented less than
1% of Avon’s consolidated Net sales and Operating profit. The Dominican
Republic’s U.S. dollar results are expected to be negatively impacted until the
country’s economic situation stabilizes and foreign currency becomes available
to pay for imported finished goods.
34