Avon 2003 Annual Report Download - page 65
Download and view the complete annual report
Please find page 65 of the 2003 Avon annual report below. You can navigate through the pages in the report by either clicking on the pages listed below, or by using the keyword search tool below to find specific information within the annual report.-
 1
1 -
2
-
3
-
4
-
5
-
6
-
7
-
8
-
9
-
10
-
11
-
12
-
13
-
14
-
15
-
16
-
17
-
18
-
19
-
20
-
21
-
22
-
23
-
24
-
25
-
26
-
27
-
28
-
29
-
30
-
31
-
32
-
33
-
34
-
35
-
36
-
37
-
38
-
39
-
40
-
41
-
42
-
43
-
44
-
45
-
46
-
47
-
48
-
49
-
50
-
51
-
52
-
53
-
54
-
 55
55 -
 56
56 -
 57
57 -
 58
58 -
 59
59 -
 60
60 -
 61
61 -
 62
62 -
 63
63 -
 64
64 -
 65
65 -
 66
66 -
 67
67 -
 68
68 -
 69
69 -
 70
70 -
 71
71 -
 72
72 -
 73
73 -
 74
74 -
 75
75 -
76
-
77
-
78
-
79
-
80
-
81
-
82
-
83
-
84
-
85
 |
 |

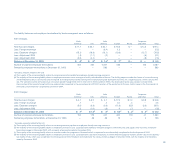
Additionally, Avon held assets at December 31, 2003 and 2002, amounting
to $22.5 and $10.1, respectively, that may be used for other benefit payments.
At December 31, 2003, the assets consisted of corporate-owned life insur-
ance policies with a cash surrender value of $20.3 and mutual funds with a
market value of $2.2. At December 31, 2002, the assets consisted of corpo-
rate-owned life insurance policies with a cash surrender value of $8.3 and
mutual funds with a market value of $1.8. The assets are recorded at market
value, with increases or decreases reflected in the Statement of Income.
The equity securities and fixed-income portfolio included in the grantor trust
and the mutual funds, discussed above, are classified as available-for-sale
and recorded at current market value. In 2003 and 2002, net unrealized gains
and losses on these securities were recorded in Accumulated other compre-
hensive loss (see Note 5, Accumulated Other Comprehensive Loss).
The cost, gross unrealized gains and losses and market value of the available-
for-sale securities as of December 31, were as follows:
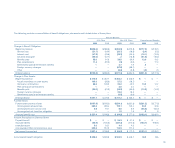
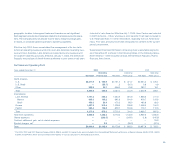
2003
Gross Gross
Unrealized Unrealized Market
Cost Gains Losses Value
Equity securities $ 44.5 $ 2.3 $ (16.0) $ 30.8
State and municipal bonds* 21.0 .9 — 21.9
Mortgage backed securities* 1.7 .1 — 1.8
Other 3.6 — (.5) 3.1
Total available-for-sale securities 70.8 3.3 (16.5) 57.6
Cash and equivalents .3 — — .3
Total $ 71.1 $ 3.3 $ (16.5) $ 57.9
* At December 31, 2003, investments with scheduled maturities in two to five years
totaled $7.5 and after five years totaled $15.2.
Payments, proceeds and net realized losses from the purchases and sales of
these securities totaled $27.7, $27.6 and $.2, respectively, during 2003. For
the purpose of determining realized gains and losses, the cost of securities
sold was based on specific identification.
2002
Gross Gross
Unrealized Unrealized Market
Cost Gains Losses Value
Equity securities $44.0 $ .7 $(20.8) $23.9
U.S. government bonds 2.3 .1 — 2.4
State and municipal bonds 20.1 1.0 — 21.1
Mortgage backed securities .7 .1 — .8
Other 3.8 — (1.2) 2.6
Total available-for-sale securities 70.9 1.9 (22.0) 50.8
Cash and equivalents .6 — — .6
Total $71.5 $1.9 $(22.0) $51.4
Payments, proceeds and net realized losses from the purchases and sales of
these securities totaled $30.4, $33.8 and $.5, respectively, during 2002.
Postemployment Benefits
Avon provides postemployment benefits, which include salary continuation,
severance benefits, disability benefits, continuation of health care benefits
and life insurance coverage to eligible former employees after employment
but before retirement. At December 31, 2003 and 2002, the accrued cost for
postemployment benefits was $42.8 and $37.9, respectively, and was
included in Employee Benefit Plans.
11. Segment Information
The Company’s reportable segments are based on geographic operations
and include operating business units in North America, Latin America, Europe
and the Pacific. The segments have similar business characteristics and each
offers similar products through common customer access methods.
The accounting policies of the reportable segments are the same as those
described in Note 1, Description of the Business and Summary of Significant
Accounting Policies. The Company evaluates the performance of its operating
segments based on operating profits or losses. Segment revenues reflect
direct sales of products to Representatives based on the Representative’s
Notes to Consolidated Financial Statements
notes to statements
84