Avon 2003 Annual Report Download - page 11
Download and view the complete annual report
Please find page 11 of the 2003 Avon annual report below. You can navigate through the pages in the report by either clicking on the pages listed below, or by using the keyword search tool below to find specific information within the annual report.-
 1
1 -
 2
2 -
 3
3 -
 4
4 -
 5
5 -
 6
6 -
 7
7 -
 8
8 -
 9
9 -
 10
10 -
 11
11 -
 12
12 -
 13
13 -
 14
14 -
 15
15 -
 16
16 -
 17
17 -
 18
18 -
 19
19 -
 20
20 -
 21
21 -
 22
22 -
23
-
24
-
25
-
26
-
27
-
28
-
29
-
30
-
31
-
32
-
33
-
34
-
35
-
36
-
37
-
38
-
39
-
40
-
41
-
42
-
43
-
44
-
45
-
46
-
47
-
48
-
49
-
50
-
51
-
52
-
53
-
54
-
55
-
56
-
57
-
58
-
59
-
60
-
61
-
62
-
63
-
64
-
65
-
66
-
67
-
68
-
69
-
70
-
71
-
72
-
73
-
74
-
75
-
76
-
77
-
78
-
79
-
80
-
81
-
82
-
83
-
84
-
85
 |
 |

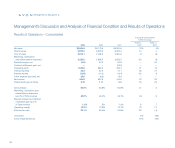
Management’s Discussion and Analysis of Financial Condition and Results of Operations
management’s discussion
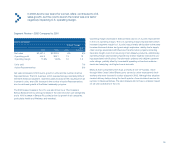
Turkish subsidiary which was consolidated beginning in the second quarter of
2003 (see Note 18, Acquisition) and costs of $10.5 (severance and asset write-
downs) associated with the repositioning of the beComing line of products (see
Note 17, Other Information). These increases in expenses were partially offset by
incremental net savings from workforce reduction programs associated with
Avon’s Business Transformation initiatives of approximately $85.0 and lower
bonus accruals of approximately $32.0.
As a percentage of Total revenue, Marketing, distribution and administrative
expenses increased .5 point in 2003 due to higher expense ratios in North
America (1.4 points, which increased the consolidated ratio by .6 point) and
the Pacific (1.2 points, which increased the consolidated ratio by .2 point),
partially offset by lower expense ratios in Europe (.9 point, which reduced the
consolidated ratio by .2 point) and Latin America (.3 point, which reduced the
consolidated ratio by .1 point).
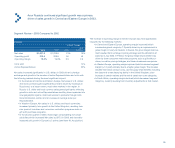
Marketing, distribution and administrative expenses increased $88.5 in
2002 primarily due to a 4% sales increase (which resulted in an increase in
expenses of approximately $69.0), an increase in consumer-related invest-
ments of $22.0, (including brochure enhancements and sampling), higher
bonus accruals of $16.0 and merit salary increases of $15.0 for certain mar-
keting, distribution and administrative personnel around the world. These
increases in expenses were partially offset by net savings from workforce
reduction programs associated with Avon’s Business Transformation initia-
tives of $30.0.
As a percentage of Total revenue, Marketing, distribution and administrative
expenses decreased .3 point in 2002 due to lower expense ratios in Europe
(2.0 points, which reduced the consolidated ratio by .4 point), the Pacific (1.5
points, which reduced the consolidated ratio by .2 point) and North America
(.1 point, which reduced the consolidated ratio by .1 point), partially offset by
a higher expense ratio in Latin America (.3 point, which increased the consoli-
dated ratio by .1 point). Additionally, the consolidated expense ratio was neg-
atively impacted by greater contributions from markets with higher expense
ratios (which increased the consolidated ratio by .3 point).
See the “Segment Review” sections of Management’s Discussion and Analysis
of Financial Condition and Results of Operations for additional information
related to changes in expense ratios by segment.
Other Expense (Income)
Interest expense decreased in both 2003 and 2002 primarily as a result of
Avon having interest rate swaps that convert approximately 90% of its fixed
rate debt to a floating rate based on LIBOR (see Note 7, Financial Instruments
and Risk Management) during a period of declining rates. In 2003, the lower
interest expense was also driven by lower average debt balances.
Interest income decreased in 2003 primarily due to lower average cash and
cash equivalent balances during 2003. Interest income increased in 2002 pri-
marily due to higher average cash and cash equivalent balances during 2002.
Other expense (income), net was unfavorable in 2003 as compared to 2002 by
$38.5 primarily due to unfavorable foreign exchange of $31.9 and the write-off
of deferred debt issue costs of $6.4 in the third quarter of 2003 related to Avon’s
convertible notes (see Note 4, Debt and Other Financing). The foreign exchange
variance was mainly due to gains of $27.8 in 2002 on net U.S. dollar denomi-
nated assets, primarily in Argentina, Venezuela, Brazil and Mexico.
Other expense (income), net was favorable in 2002 as compared to 2001,
mainly due to favorable foreign exchange in 2002 ($23.7) and a charge in
2001 related to the settlement of a disputed excise tax liability in Argentina
($6.4) (see Note 14, Contingencies). Net foreign exchange was favorable in
2002 primarily due to an increase in foreign exchange gains of $19.8 on net
U.S. dollar denominated assets primarily in Argentina, Venezuela, Brazil
and Mexico.
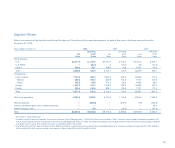
Effective Tax Rate
The effective tax rate was lower in 2003 primarily due to tax audit settlements
and an interest refund from the IRS, which, collectively, reduced the effective rate
by approximately 2.5 points. Additionally, the 2003 rate was impacted favorably
by changes in the earnings mix and tax rates of international subsidiaries.
30