Avon 2003 Annual Report Download - page 21
Download and view the complete annual report
Please find page 21 of the 2003 Avon annual report below. You can navigate through the pages in the report by either clicking on the pages listed below, or by using the keyword search tool below to find specific information within the annual report.-
 1
1 -
2
-
3
-
4
-
5
-
6
-
7
-
8
-
9
-
10
-
 11
11 -
 12
12 -
 13
13 -
 14
14 -
 15
15 -
 16
16 -
 17
17 -
 18
18 -
 19
19 -
 20
20 -
 21
21 -
 22
22 -
 23
23 -
 24
24 -
 25
25 -
 26
26 -
 27
27 -
 28
28 -
 29
29 -
 30
30 -
 31
31 -
32
-
33
-
34
-
35
-
36
-
37
-
38
-
39
-
40
-
41
-
42
-
43
-
44
-
45
-
46
-
47
-
48
-
49
-
50
-
51
-
52
-
53
-
54
-
55
-
56
-
57
-
58
-
59
-
60
-
61
-
62
-
63
-
64
-
65
-
66
-
67
-
68
-
69
-
70
-
71
-
72
-
73
-
74
-
75
-
76
-
77
-
78
-
79
-
80
-
81
-
82
-
83
-
84
-
85
 |
 |

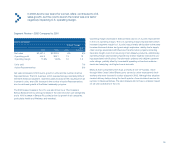
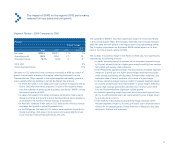
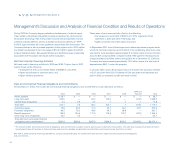
Segment Review – 2002 Compared to 2001
Europe
%/Point Change
Local
2002 2001 US $ Currency
Net sales $1,228.6 $1,008.5 22% 19%
Operating profit 208.8 164.0 27 25
Operating margin 16.9% 16.2% .7 .7
Units sold 27%
Active Representatives 22%
Net sales increased in U.S. dollars and local currency in 2002 driven by sub-
stantial growth in units and the number of active Representatives with the fol-
lowing markets having the most significant impact:
• In the markets of Central and Eastern Europe, Net sales in U.S. dollars
and local currency grew significantly, primarily in Russia where local
currency sales nearly doubled. In Russia, units doubled as a result of
increased market coverage and incremental consumer investments
(including advertising and sampling) and strategic pricing investments,
as well as an improvement in Russia’s economic environment.
• In the United Kingdom, Net sales in U.S. dollars and local currency
increased faster than the market driven by increased consumer invest-
ments such as promotional spending.
The increase in operating margin in Europe was most significantly impacted
by the following markets:
• In Central and Eastern Europe, operating margin improved (which
increased segment margin by 1.0 point) primarily due to an improve-
ment in Russia’s expense ratio resulting from significant sales growth
and general cost containment initiatives, partially offset by incremental
consumer-related spending, such as advertising. The lower expense
ratio was partially offset by a lower gross margin due to strategic pricing
investments and other consumer motivation programs.
• In South Africa, operating margin improved (which increased segment
margin by .3 point) primarily due to a lower expense ratio resulting from
higher sales.
• In the United Kingdom, operating margin improved (which increased
segment margin by .1 point) due to a decrease in the expense ratio
resulting from general cost containment initiatives, partially offset by
increased spending for special promotional offers and a decrease in
gross margin. Gross margin declined due to an increase in the cost of
imported products, resulting from the strengthening of the Euro and
Polish zloty against the British pound, and an investment in supply chain
Business Transformation initiatives including expenses associated with
the closing of a manufacturing facility.
• In Western Europe, excluding the United Kingdom, operating margin
declined (which reduced segment margin by 1.0 point) primarily due to
a lower gross margin, most significantly in Germany, due to strategic
pricing investments, increased consumer investments, an unfavorable
product mix, and higher expense ratios in Germany and Italy as
a result of fixed costs on a lower sales base.
Operating margin also improved due to greater contributions from countries
with higher operating margins (which increased segment margin by .9 point).
Management’s Discussion and Analysis of Financial Condition and Results of Operations
management’s discussion
40