Avon 2003 Annual Report Download - page 24
Download and view the complete annual report
Please find page 24 of the 2003 Avon annual report below. You can navigate through the pages in the report by either clicking on the pages listed below, or by using the keyword search tool below to find specific information within the annual report.-
 1
1 -
2
-
3
-
4
-
5
-
6
-
7
-
8
-
9
-
10
-
11
-
12
-
13
-
 14
14 -
 15
15 -
 16
16 -
 17
17 -
 18
18 -
 19
19 -
 20
20 -
 21
21 -
 22
22 -
 23
23 -
 24
24 -
 25
25 -
 26
26 -
 27
27 -
 28
28 -
 29
29 -
 30
30 -
 31
31 -
 32
32 -
 33
33 -
 34
34 -
35
-
36
-
37
-
38
-
39
-
40
-
41
-
42
-
43
-
44
-
45
-
46
-
47
-
48
-
49
-
50
-
51
-
52
-
53
-
54
-
55
-
56
-
57
-
58
-
59
-
60
-
61
-
62
-
63
-
64
-
65
-
66
-
67
-
68
-
69
-
70
-
71
-
72
-
73
-
74
-
75
-
76
-
77
-
78
-
79
-
80
-
81
-
82
-
83
-
84
-
85
 |
 |

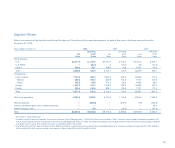
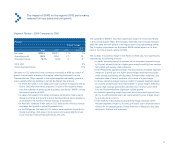
Net cash flow from operating activities improved $179.9 million
in 2003 versus 2002, to $745.3 million.
Liquidity and Capital Resources
Avon’s principal sources of funds historically have been cash flows from opera-
tions, commercial paper and borrowings under uncommitted lines of credit.
Management believes that cash from operations and available sources of financ-
ing are adequate to meet anticipated requirements for working capital, dividends,
capital expenditures, the stock repurchase program and other cash needs.
Cash Flows
Net Cash Provided by Operating Activities
Net cash provided by operating activities in 2003 was $179.9 favorable to
2002 principally reflecting the following:
• higher Net income (adjusted for non-cash items),
• lower contributions of $60.0 to the U.S. pension plan in 2003 ($60.0
in 2003 versus $120.0 in 2002),
• a tax payment of $20.0 in 2002 deferred from 2001, and
• favorable variances in accounts receivable and inventories.
These sources of cash were partially offset by the following:
• payments, net of associated benefits and refund, of $45.1 during 2003
as a result of worldwide tax audit settlements. In addition, a payment of
$68.7 was made during January 2004 with respect to another tax audit set-
tlement. The impact of this January 2004 payment will be partially offset by
the tax benefit on the interest portion of the payment.
• higher cash outlays in 2003 for bonus payments.
Avon maintains qualified defined pension plans and unfunded supplemental pen-
sion benefit plans (see Note 10, Employee Benefit Plans). Avon’s funding policy
for these plans is based on legal requirements and cash flows. The amounts nec-
essary to fund future obligations under these plans could vary depending on esti-
mated assumptions (as detailed in “Critical Accounting Estimates”). The future
funding for these plans will depend on economic conditions, employee demo-
graphics, mortality rates, the number of associates electing to take lump-sum
distributions, investment performance and funding decisions. Based on current
assumptions, Avon expects to contribute approximately $90.0 and $37.0,
respectively, to its U.S. and international pension plans in 2004.
Avon offers extended payment terms to select Representatives during certain
campaigns. The number of Representatives electing this extended payment
option can impact the timing of cash flows related to the collection of Accounts
receivable balances. During 2003, the favorable variance in Accounts receiv-
able was mainly due to fewer Representatives electing the extended payment
term option during the holiday season in 2003 versus 2002.
Inventories of $653.4 at December 31, 2003, were higher than at December 31,
2002. At the same time, inventory days outstanding declined from 2002. It is
Avon’s objective to continue to focus on inventory management. However, the
addition or expansion of product lines, which are subject to changing fashion
trends and consumer tastes, as well as planned expansion in high growth
markets, may cause inventory levels to grow periodically.
Net Cash Used by Investing Activities
Net cash used in investing activities in 2003 was $55.4 higher than 2002
resulting from the following:
• higher capital expenditures and
• the purchase of the outstanding share in Avon’s Turkish joint venture
business for $18.4 (see Note 18, Acquisition),
• partially offset by proceeds of $6.9 on the sale of property in Mexico
in 2003.
Capital expenditures during 2003 were $162.6 compared with $126.5 in 2002.
The increase in capital spending was primarily driven by continued investments
for capacity expansion (primarily the expansion of a manufacturing and distribu-
tion facility in Mexico, the expansion of a distribution facility in Brazil, and a new
manufacturing facility in Russia), facility modernization (primarily the construc-
tion of a new research and development facility in the U.S.), and improvements
to existing facilities, information systems and equipment replacement projects.
Numerous construction and information systems projects were in progress at
December 31, 2003, with an estimated cost to complete of approximately
$180.0. Capital expenditures in 2004 are currently expected to be in the range
of $200.0–$250.0 and will be funded through cash flow from operations. These
expenditures will include continued investments for capacity expansion, facility
modernization (primarily the continuation of construction of the new research
and development facility in the U.S.), information systems and equipment
replacement projects. 43