Avon 2003 Annual Report Download - page 22
Download and view the complete annual report
Please find page 22 of the 2003 Avon annual report below. You can navigate through the pages in the report by either clicking on the pages listed below, or by using the keyword search tool below to find specific information within the annual report.-
 1
1 -
2
-
3
-
4
-
5
-
6
-
7
-
8
-
9
-
10
-
11
-
 12
12 -
 13
13 -
 14
14 -
 15
15 -
 16
16 -
 17
17 -
 18
18 -
 19
19 -
 20
20 -
 21
21 -
 22
22 -
 23
23 -
 24
24 -
 25
25 -
 26
26 -
 27
27 -
 28
28 -
 29
29 -
 30
30 -
 31
31 -
 32
32 -
33
-
34
-
35
-
36
-
37
-
38
-
39
-
40
-
41
-
42
-
43
-
44
-
45
-
46
-
47
-
48
-
49
-
50
-
51
-
52
-
53
-
54
-
55
-
56
-
57
-
58
-
59
-
60
-
61
-
62
-
63
-
64
-
65
-
66
-
67
-
68
-
69
-
70
-
71
-
72
-
73
-
74
-
75
-
76
-
77
-
78
-
79
-
80
-
81
-
82
-
83
-
84
-
85
 |
 |

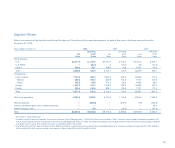
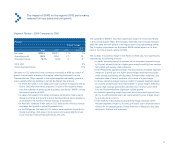
Segment Review – 2003 Compared to 2002
Pacific
%/Point Change
Local
2003 2002 US $ Currency
Net sales $923.4 $829.7 11% 7%
Operating profit 156.6 133.6 17 13
Operating margin 16.7% 15.8% .9 .9
Units sold 2%
Active Representatives 11%
Net sales in U.S. dollars and local currencies increased in 2003 as a result of
growth in most major markets in the region, reflecting increases in active
Representatives. Major markets in the region experienced healthy growth in
units, partially offset by declines in certain Southeast Asia markets.
• In China, Net sales in U.S. dollars and local currency increased primarily
due to consumer motivation programs, in spite of the negative impact
from the outbreak of severe acute respiratory syndrome (“SARS”) during
the second quarter of 2003.
• In Japan, Net sales in U.S dollars increased significantly mainly due to
foreign exchange and growth in active Representatives driven largely by
an increase in the number of direct mailings to customers.
• In Australia, increases in Net sales in U.S. dollars were driven by foreign
exchange and growth in active Representatives.
• In the Philippines, Net sales in U.S. dollars were negatively impacted by
foreign exchange. Net sales in local currency increased slightly driven
by an increase in active Representatives and units.
The outbreak of SARS in Asia had a significant impact on China and Taiwan
in the second quarter 2003. The Company estimates that it reduced full year
2003 Net sales and unit growth in the region each by two percentage points.
The Company experienced no significant SARS-related impact on its busi-
ness in the third or fourth quarter of 2003.
The increase in operating margin in the Pacific in 2003 was most significantly
impacted by the following markets:
• In Japan, operating margin increased (which increased segment margin
by .6 point) primarily due to a higher gross margin resulting from savings
associated with supply chain initiatives.
• In the Philippines, operating margin improved (which increased segment
margin by .6 point) due to a higher gross margin resulting from supply
chain savings associated with Business Transformation initiatives, and
increased sales of beauty products, which have a higher margin.
• In China, operating margin improved (which increased segment margin
by .3 point) primarily due to an improvement in gross margin, reflecting
supply chain savings associated with Business Transformation initia-
tives and the benefits from significant volume growth.
• In Australia, operating margin improved (which increased segment mar-
gin by .4 point) primarily due to an improvement in gross margin driven
by a strong local currency.
• In the markets of Southeast Asia operating margin declined (which
reduced segment margin by .6 point), principally due to expenses asso-
ciated with the reorganization of sales branches in Malaysia, and sales
declines in Thailand and Indonesia.
The impact of SARS on the region’s 2003 performance
reduced full-year sales and unit growth.
41