Asus 2011 Annual Report Download - page 99
Download and view the complete annual report
Please find page 99 of the 2011 Asus annual report below. You can navigate through the pages in the report by either clicking on the pages listed below, or by using the keyword search tool below to find specific information within the annual report.-
 1
1 -
2
-
3
-
4
-
5
-
6
-
7
-
8
-
9
-
10
-
11
-
12
-
13
-
14
-
15
-
16
-
17
-
18
-
19
-
20
-
21
-
22
-
23
-
24
-
25
-
26
-
27
-
28
-
29
-
30
-
31
-
32
-
33
-
34
-
35
-
36
-
37
-
38
-
39
-
40
-
41
-
42
-
43
-
44
-
45
-
46
-
47
-
48
-
49
-
50
-
51
-
52
-
53
-
54
-
55
-
56
-
57
-
58
-
59
-
60
-
61
-
62
-
63
-
64
-
65
-
66
-
67
-
68
-
69
-
70
-
71
-
72
-
73
-
74
-
75
-
76
-
77
-
78
-
79
-
80
-
81
-
82
-
83
-
84
-
85
-
86
-
87
-
88
-
 89
89 -
 90
90 -
 91
91 -
 92
92 -
 93
93 -
 94
94 -
 95
95 -
 96
96 -
 97
97 -
 98
98 -
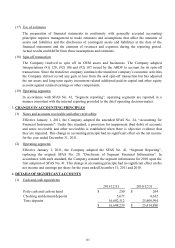
 99
99 -
 100
100 -
 101
101 -
 102
102 -
 103
103 -
 104
104 -
 105
105 -
 106
106 -
 107
107 -
 108
108 -
 109
109 -
110
-
111
-
112
-
113
-
114
-
115
-
116
-
117
-
118
-
119
-
120
-
121
-
122
-
123
-
124
-
125
-
126
-
127
-
128
-
129
-
130
-
131
-
132
-
133
-
134
-
135
-
136
-
137
-
138
-
139
-
140
-
141
-
142
-
143
-
144
-
145
-
146
-
147
-
148
-
149
-
150
-
151
-
152
-
153
-
154
-
155
-
156
-
157
-
158
-
159
-
160
-
161
-
162
-
163
-
164
-
165
-
166
-
167
-
168
-
169
-
170
-
171
-
172
-
173
-
174
-
175
-
176
-
177
-
178
-
179
-
180
-
181
-
182
-
183
-
184
-
185
-
186
-
187
-
188
-
189
-
190
-
191
-
192
-
193
-
194
-
195
-
196
-
197
-
198
-
199
-
200
-
201
-
202
-
203
-
204
-
205
-
206
-
207
-
208
-
209
-
210
-
211
-
212
-
213
-
214
-
215
-
216
-
217
-
218
-
219
-
220
-
221
-
222
-
223
-
224
-
225
-
226
-
227
 |
 |

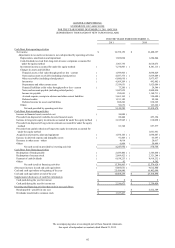
95
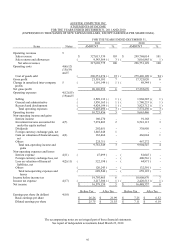
ASUSTEK COMPUTER INC.
STATEMENTS OF INCOME
FOR THE YEARS ENDED DECEMBER 31, 2011 AND 2010
(EXPRESSED IN THOUSANDS OF NEW TAIWAN DOLLARS, EXCEPT EARNINGS PER SHARE DATA)
FOR THE YEARS ENDED DECEMBER 31,
2011
2010
Items
Notes
AMOUNT
%
AMOUNT
%
The accompanying notes are an integral part of these financial statements.
See report of independent accountants dated March 23, 2012.
Operating revenues
5
Sales revenue
$
327,013,339
103
$
299,768,014
101
Sales returns and allowances
(
9,343,564
)
(
3
)
(
3,016,885
)
(
1
)
Net sales revenues
317,669,775
100
296,751,129
100
Operating costs
4(6)(12)
(15)(19)
and 5
Cost of goods sold
(
296,351,674
)
(
93
)
(
279,426,109
)
(
94
)
Gross profit
21,318,101
7
17,325,020
6
Change in unrealized inter-company
profits
5
(
1,191,149
)
(
1
)
(
89,344
)
-
Net gross profit
20,126,952
6
17,235,676
6
Operating expenses
4(12)(15)
(19)and 5
Selling
(
2,549,132
)
(
1
)
(
1,968,285
)
(
1
)
General and administrative
(
1,930,165
)
(
1
)
(
1,780,233
)
(
1
)
Research and development
(
4,924,199
)
(
1
)
(
3,823,712
)
(
1
)
Total operating expenses
(
9,403,496
)
(
3
)
(
7,572,230
)
(
3
)
Operating income
10,723,456
3
9,663,446
3
Non-operating income and gains
Interest income
160,270
-
91,168
-
Investment income accounted for
under the equity method
4(7)
7,274,803
2
8,541,113
3
Dividends
292,051
-
338,950
-
Foreign currency exchange gain, net
1,645,648
1
-
-
Gain on valuation of financial assets,
net
4(2)
163,466
-
466,044
1
Others
225,311
-
467,272
-
Total non-operating income and
gains
9,761,549
3
9,904,547
4
Non-operating expenses and losses
Interest expense
4(11)
(
47,099
)
-
(
81,045
)
-
Foreign currency exchange loss, net
-
-
(
400,516
)
-
Loss on valuation of financial
liabilities, net
4(2)(11)
(
522,198
)
-
(
44,971
)
-
Others
(
120,243
)
-
(
132,591
)
-
Total non-operating expenses and
losses
(
689,540
)
-
(
659,123
)
-
Income before income tax
19,795,465
6
18,908,870
7
Income tax expense
4(17)
(
3,217,306
)
(
1
)
(
2,420,513
)
(
1
)
Net income
$
16,578,159
5
$
16,488,357
6
Before Tax
After Tax
Before Tax
After Tax
Earnings per share (In dollars)
4(18)
Basic earnings per share
$
26.26
$
21.99
$
7.25
$
6.32
Diluted earnings per share
$
25.75
$
21.55
$
7.11
$
6.19