Asus 2011 Annual Report Download - page 91
Download and view the complete annual report
Please find page 91 of the 2011 Asus annual report below. You can navigate through the pages in the report by either clicking on the pages listed below, or by using the keyword search tool below to find specific information within the annual report.-
 1
1 -
2
-
3
-
4
-
5
-
6
-
7
-
8
-
9
-
10
-
11
-
12
-
13
-
14
-
15
-
16
-
17
-
18
-
19
-
20
-
21
-
22
-
23
-
24
-
25
-
26
-
27
-
28
-
29
-
30
-
31
-
32
-
33
-
34
-
35
-
36
-
37
-
38
-
39
-
40
-
41
-
42
-
43
-
44
-
45
-
46
-
47
-
48
-
49
-
50
-
51
-
52
-
53
-
54
-
55
-
56
-
57
-
58
-
59
-
60
-
61
-
62
-
63
-
64
-
65
-
66
-
67
-
68
-
69
-
70
-
71
-
72
-
73
-
74
-
75
-
76
-
77
-
78
-
79
-
80
-
 81
81 -
 82
82 -
 83
83 -
 84
84 -
 85
85 -
 86
86 -
 87
87 -
 88
88 -
 89
89 -
 90
90 -
 91
91 -
 92
92 -
 93
93 -
 94
94 -
 95
95 -
 96
96 -
 97
97 -
 98
98 -
 99
99 -
 100
100 -
 101
101 -
102
-
103
-
104
-
105
-
106
-
107
-
108
-
109
-
110
-
111
-
112
-
113
-
114
-
115
-
116
-
117
-
118
-
119
-
120
-
121
-
122
-
123
-
124
-
125
-
126
-
127
-
128
-
129
-
130
-
131
-
132
-
133
-
134
-
135
-
136
-
137
-
138
-
139
-
140
-
141
-
142
-
143
-
144
-
145
-
146
-
147
-
148
-
149
-
150
-
151
-
152
-
153
-
154
-
155
-
156
-
157
-
158
-
159
-
160
-
161
-
162
-
163
-
164
-
165
-
166
-
167
-
168
-
169
-
170
-
171
-
172
-
173
-
174
-
175
-
176
-
177
-
178
-
179
-
180
-
181
-
182
-
183
-
184
-
185
-
186
-
187
-
188
-
189
-
190
-
191
-
192
-
193
-
194
-
195
-
196
-
197
-
198
-
199
-
200
-
201
-
202
-
203
-
204
-
205
-
206
-
207
-
208
-
209
-
210
-
211
-
212
-
213
-
214
-
215
-
216
-
217
-
218
-
219
-
220
-
221
-
222
-
223
-
224
-
225
-
226
-
227
 |
 |

87
The root causes of the financial ratio change in the last two years:
Ratio of liabilities to assets: The rise in the revenue growth, accounts payable and accrued expenses from relevant
stock preparation.
Ratio of long-term capital to fixed assets: Due to the current profits leading to increase in shareholder’s equity while
the fixed assets were slightly declined due to depreciation and amortization, the long-term funds to fixed assets ratio
increased.
Current ratio: The rise in current revenue growth and the accounts payable from relevant stock preparation led to
increase in current liabilities.
Quick ratio: The rise in current revenue growth and accounts payable to relevant stock preparation and expense
caused the increase in current liabilities.
Times interest earned ratio: The expiration of current CB and the reduction in amortization amount (The CE and
ECB issued by the company does not pay out relevant interests. However, in cooperation with the provisions of new
Declaration, the company liabilities were depreciated and amortized to interest expense without the actual cash
disbursements) led to increase in time interest earned ratio.
Inventory turnover (times): Due to the current revenue growth, the relevant stock preparation was reflected on
inventory ending balance.
Account payable turnover (times): Due to the current revenue growth, the accounts payable balance generated from
stock preparation was higher.
Fixed assets turnover (times): Due to the current revenue growth, the fixed assets net values were amortized and
depreciated to reveal minor decline.
Ratio of return on total assets: Due to the increase in net operating profit after tax for the current year, the Return On
Total Assets increased.
Ratio of return on shareholders’ equity: Due to the capital reduction last year, the revenue growth and return on
equity increased.
Ratio of operating income to issued capital stock: Due to the increase in the operating profit for the current year was
smaller than the increase in capitalization of returned earnings, the operating profits to paid-up capital ratio declined.
Cash flow ratio: The revenue growth, the accounts receivable generated from sales of goods and net inventory
increased, causing the net cash inflow of current operating activities to decline and thereby the cash flow ratio
declined.
Cash flow adequacy ratio: Due to the regulatory agency’s positive control over the quantity in stock, the inventory
increase for the last five years was reduced and the net cash inflow of total operating activities in the last five years
increased. Therefore, the Cash Flow Adequacy Ratio increased.
Cash reinvestment ratio: Due to the revenue growth of current year, the accounts receivable generated from sales o
f
goods and net inventory increased, causing the net cash inflow from operating activities to be decreased compared with
last period.
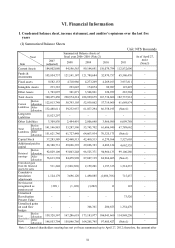
Note 1: ASUS has adopted the principles under Accounting Research and Development Foundation in
Taiwan (97) Kee.mi.tzi No. 331 Letter and (98) Kee.mi.tzi No. 046 Letter to have the convertible
bond adjusted retroactively. Therefore, the 2007 financial information were adjusted
retroactively.
Note 2: The financial information is reviewed by CPA.
Note 3: Accounts receivable includes the amount of long-term accounts receivable- related party that is in
compliance with trade terms and conditions.
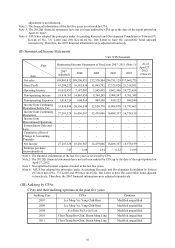
Note 4: The 2012Q1 financial statements have not yet been audited by CPA up to the date of the report
printed on April 27, 2012.
Note 5: Equations:
1. Financial structure
(1) Ratio of liabilities to assets = Total liability/Total assets
(2) Ratio of long-Term capital to fixed assets = (Net shareholders’ equity + Long-term liability)
/ Net fixed assets
2. Solvency
(1) Current ratio = Current assets / current liability
(2) Quick ratio = (Current assets – Inventory – Prepaid expense) / Current liability
(3) Times interest earned ratio = Net income before tax and interest expense / Interest expense
of the year
3. Operating ability