Asus 2011 Annual Report Download - page 138
Download and view the complete annual report
Please find page 138 of the 2011 Asus annual report below. You can navigate through the pages in the report by either clicking on the pages listed below, or by using the keyword search tool below to find specific information within the annual report.-
 1
1 -
2
-
3
-
4
-
5
-
6
-
7
-
8
-
9
-
10
-
11
-
12
-
13
-
14
-
15
-
16
-
17
-
18
-
19
-
20
-
21
-
22
-
23
-
24
-
25
-
26
-
27
-
28
-
29
-
30
-
31
-
32
-
33
-
34
-
35
-
36
-
37
-
38
-
39
-
40
-
41
-
42
-
43
-
44
-
45
-
46
-
47
-
48
-
49
-
50
-
51
-
52
-
53
-
54
-
55
-
56
-
57
-
58
-
59
-
60
-
61
-
62
-
63
-
64
-
65
-
66
-
67
-
68
-
69
-
70
-
71
-
72
-
73
-
74
-
75
-
76
-
77
-
78
-
79
-
80
-
81
-
82
-
83
-
84
-
85
-
86
-
87
-
88
-
89
-
90
-
91
-
92
-
93
-
94
-
95
-
96
-
97
-
98
-
99
-
100
-
101
-
102
-
103
-
104
-
105
-
106
-
107
-
108
-
109
-
110
-
111
-
112
-
113
-
114
-
115
-
116
-
117
-
118
-
119
-
120
-
121
-
122
-
123
-
124
-
125
-
126
-
127
-
 128
128 -
 129
129 -
 130
130 -
 131
131 -
 132
132 -
 133
133 -
 134
134 -
 135
135 -
 136
136 -
 137
137 -
 138
138 -
 139
139 -
 140
140 -
 141
141 -
 142
142 -
 143
143 -
 144
144 -
 145
145 -
 146
146 -
 147
147 -
 148
148 -
149
-
150
-
151
-
152
-
153
-
154
-
155
-
156
-
157
-
158
-
159
-
160
-
161
-
162
-
163
-
164
-
165
-
166
-
167
-
168
-
169
-
170
-
171
-
172
-
173
-
174
-
175
-
176
-
177
-
178
-
179
-
180
-
181
-
182
-
183
-
184
-
185
-
186
-
187
-
188
-
189
-
190
-
191
-
192
-
193
-
194
-
195
-
196
-
197
-
198
-
199
-
200
-
201
-
202
-
203
-
204
-
205
-
206
-
207
-
208
-
209
-
210
-
211
-
212
-
213
-
214
-
215
-
216
-
217
-
218
-
219
-
220
-
221
-
222
-
223
-
224
-
225
-
226
-
227
 |
 |

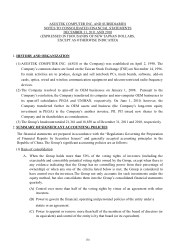
134
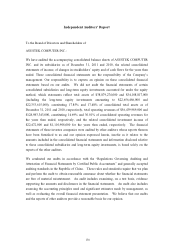
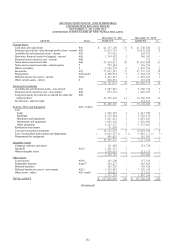
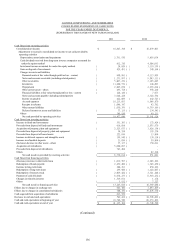
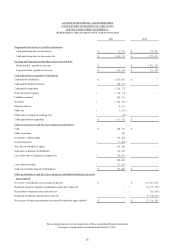
ASUSTEK COMPUTER INC. AND SUBSIDIARIES
CONSOLIDATED STATEMENTS OF INCOME
FOR THE YEARS ENDED DECEMBER 31, 2011 AND 2010
(EXPRESSED IN THOUSANDS OF NEW TAIWAN DOLLARS, EXCEPT EARNING PER SHARE DATA)
FOR THE YEARS ENDED DECEMBER 31,
2011
2010
Items
Notes
AMOUNT
%
AMOUNT
%
The accompanying notes are an integral part of these consolidated financial statements.
See report of independent accountants dated March 23, 2012.
Sales revenues 5
$
384,112,294 100
$
429,721,249 100
Cost of goods sold 4(7)(16)
(19)(23)
and 5
(
331,043,154
)
(
86
)
(
377,858,761
)
(
88
)
Gross profit 53,069,140 14 51,862,488 12
Operating expenses 4(16)(19)
(23) and 5
Selling
(
22,167,328
)
(
6
)
(
18,292,802
)
(
4
)
General and administrative
(
4,988,744
)
(
1
)
(
6,224,202
)
(
1
)
Research and development
(
7,692,322
)
(
2
)
(
8,370,211
)
(
2
)
Total operating expenses
(
34,848,394
)
(
9
)
(
32,887,215
)
(
7
)
Operating income 18,220,746 518,975,273 5
Non-operating income and gains
Interest income 369,387 -245,222 -
Investment income accounted for
under the equity method
4(8)
24,826 -1,110,159 -
Dividends 320,720 -362,148 -
Gain on disposal of investments 429,491 -540,364 -
Foreign currency exchange gain, net 1,848,263 1 - -
Gain on valuation of financial assets,
net
4(2)
256,902 -1,373,218 1
Others 541,462 -1,038,379 -
Total non-operating income and
gains 3,791,051 14,669,490 1
Non-operating expenses and losses
Interest expense 4(14)
(
128,960
)
-
(
207,620
)
-
Foreign currency exchange loss, net - -
(
820,950
)
-
Loss on valuation of financial
liabilities, net
4(2)
(
1,246,772
)
(
1
)
(
324,249
)
-
Others
(
501,834
)
-
(
866,210
)
(
1
)
Total non-operating expenses and
losses
(
1,877,566
)
(
1
)
(
2,219,029
)
(
1
)
Income before income tax 20,134,231 521,425,734 5
Income tax expense 4(21)
(
3,286,833
)
(
1
)
(
3,386,131
)
(
1
)
Consolidated net income
$
16,847,398 4
$
18,039,603 4
Attributable to:
Parent Company
$
16,578,159 4
$
16,488,357 4
Minority interests 269,239 -1,551,246 -
$
16,847,398 4
$
18,039,603 4
Before Tax After Tax Before Tax After Tax
Earnings per share (In dollars) 4(22)
Basic earnings per share
$
26.26
$
21.99
$
7.25
$
6.32
Diluted earnings per share
$
25.75
$
21.55
$
7.11
$
6.19