Asus 2011 Annual Report Download - page 191
Download and view the complete annual report
Please find page 191 of the 2011 Asus annual report below. You can navigate through the pages in the report by either clicking on the pages listed below, or by using the keyword search tool below to find specific information within the annual report.-
 1
1 -
2
-
3
-
4
-
5
-
6
-
7
-
8
-
9
-
10
-
11
-
12
-
13
-
14
-
15
-
16
-
17
-
18
-
19
-
20
-
21
-
22
-
23
-
24
-
25
-
26
-
27
-
28
-
29
-
30
-
31
-
32
-
33
-
34
-
35
-
36
-
37
-
38
-
39
-
40
-
41
-
42
-
43
-
44
-
45
-
46
-
47
-
48
-
49
-
50
-
51
-
52
-
53
-
54
-
55
-
56
-
57
-
58
-
59
-
60
-
61
-
62
-
63
-
64
-
65
-
66
-
67
-
68
-
69
-
70
-
71
-
72
-
73
-
74
-
75
-
76
-
77
-
78
-
79
-
80
-
81
-
82
-
83
-
84
-
85
-
86
-
87
-
88
-
89
-
90
-
91
-
92
-
93
-
94
-
95
-
96
-
97
-
98
-
99
-
100
-
101
-
102
-
103
-
104
-
105
-
106
-
107
-
108
-
109
-
110
-
111
-
112
-
113
-
114
-
115
-
116
-
117
-
118
-
119
-
120
-
121
-
122
-
123
-
124
-
125
-
126
-
127
-
128
-
129
-
130
-
131
-
132
-
133
-
134
-
135
-
136
-
137
-
138
-
139
-
140
-
141
-
142
-
143
-
144
-
145
-
146
-
147
-
148
-
149
-
150
-
151
-
152
-
153
-
154
-
155
-
156
-
157
-
158
-
159
-
160
-
161
-
162
-
163
-
164
-
165
-
166
-
167
-
168
-
169
-
170
-
171
-
172
-
173
-
174
-
175
-
176
-
177
-
178
-
179
-
180
-
 181
181 -
 182
182 -
 183
183 -
 184
184 -
 185
185 -
 186
186 -
 187
187 -
 188
188 -
 189
189 -
 190
190 -
 191
191 -
 192
192 -
 193
193 -
 194
194 -
 195
195 -
 196
196 -
 197
197 -
 198
198 -
 199
199 -
 200
200 -
 201
201 -
202
-
203
-
204
-
205
-
206
-
207
-
208
-
209
-
210
-
211
-
212
-
213
-
214
-
215
-
216
-
217
-
218
-
219
-
220
-
221
-
222
-
223
-
224
-
225
-
226
-
227
 |
 |

187
~59~
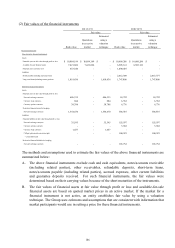
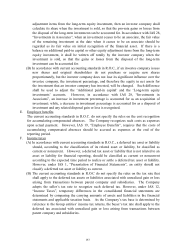
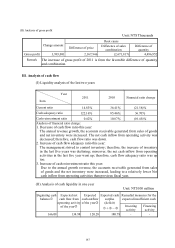
C. The fair value of convertible bonds payable is not available, and a valuation technique is used.
The assumptions used in the said valuation are the same as those used by financial market
traders when quoting their prices. However, the fair value is not expected to equal future
cash outflow.
D. The fair values of derivative financial instruments which include unrealized gain or loss on
unsettled contracts were determined based on the amounts to be received or paid assuming that
the contracts were settled as of the reporting date.
E. Financial assets carried at cost are invested in unquoted equity instruments and mutual fund
bond obligations whose fair value cannot be estimated.
F. The fair value of long-term loans was estimated by the discounted value of expected cash flow.
The discount rate used was based on the interest rate of long-term loans with similar
conditions. Based on the results of the evaluation, the fair value is close to book value.
(3) Procedure of financial risk control
The management can effectively control significant market risks after appropriately taking into
consideration the economic environment, competition, and changes of market value risk by setting
the goal of risk management.
(4) Information of material financial risk
A. Market risk
(A) The main currency for purchases and sales of the Group is the US dollar. The Group uses
the principle of natural hedge to mitigate the risk and utilizes spot or forward contracts,
currency swaps and currency option contracts to hedge foreign currency risk. The
forward exchange, currency swaps and currency option contracts’ duration corresponds
to the Group’s foreign currency assets’ and liabilities’ due date and future cash flows.
The exchange gain and loss resulting from foreign currency assets and liabilities will be
offset by the exchange gain and loss resulting from the hedged item.
(B) The open-end funds and listed and OTC stocks held by the Group are classified as
financial assets at fair value through profit or loss and available-for-sale financial assets.
As these assets are measured at fair value, the Group has risk exposure related to
changes in fair value in an equity securities market.
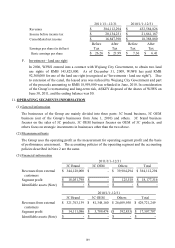
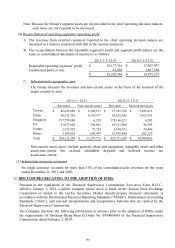
(C) Information of significant foreign currency denominated assets and liabilities:
Foreign Currency Foreign Currency
(in dollars) Rate NTD (in dollars) Rate NTD
Financial assets
Monetary item
USD
911,800,716
$
30.275
27,604,767
$
1,433,223,798
$
29.13
41,749,809
$
EUR 351,013,985 39.18 13,752,728 223,388,817 38.92 8,694,293
RMB 5,669,965,355 4.8101 27,273,100 1,665,940,459 4.4205 7,364,290
Financial liabilities
Monetary item
USD 2,083,890,167 30.275 63,089,775 1,750,708,860 29.13 50,998,149
RMB 1,337,789,905 4.8101 6,434,903 1,013,400,940 4.4205 4,479,739
2011/12/31 2010/12/31