Asus 2011 Annual Report Download - page 200
Download and view the complete annual report
Please find page 200 of the 2011 Asus annual report below. You can navigate through the pages in the report by either clicking on the pages listed below, or by using the keyword search tool below to find specific information within the annual report.-
 1
1 -
2
-
3
-
4
-
5
-
6
-
7
-
8
-
9
-
10
-
11
-
12
-
13
-
14
-
15
-
16
-
17
-
18
-
19
-
20
-
21
-
22
-
23
-
24
-
25
-
26
-
27
-
28
-
29
-
30
-
31
-
32
-
33
-
34
-
35
-
36
-
37
-
38
-
39
-
40
-
41
-
42
-
43
-
44
-
45
-
46
-
47
-
48
-
49
-
50
-
51
-
52
-
53
-
54
-
55
-
56
-
57
-
58
-
59
-
60
-
61
-
62
-
63
-
64
-
65
-
66
-
67
-
68
-
69
-
70
-
71
-
72
-
73
-
74
-
75
-
76
-
77
-
78
-
79
-
80
-
81
-
82
-
83
-
84
-
85
-
86
-
87
-
88
-
89
-
90
-
91
-
92
-
93
-
94
-
95
-
96
-
97
-
98
-
99
-
100
-
101
-
102
-
103
-
104
-
105
-
106
-
107
-
108
-
109
-
110
-
111
-
112
-
113
-
114
-
115
-
116
-
117
-
118
-
119
-
120
-
121
-
122
-
123
-
124
-
125
-
126
-
127
-
128
-
129
-
130
-
131
-
132
-
133
-
134
-
135
-
136
-
137
-
138
-
139
-
140
-
141
-
142
-
143
-
144
-
145
-
146
-
147
-
148
-
149
-
150
-
151
-
152
-
153
-
154
-
155
-
156
-
157
-
158
-
159
-
160
-
161
-
162
-
163
-
164
-
165
-
166
-
167
-
168
-
169
-
170
-
171
-
172
-
173
-
174
-
175
-
176
-
177
-
178
-
179
-
180
-
181
-
182
-
183
-
184
-
185
-
186
-
187
-
188
-
189
-
 190
190 -
 191
191 -
 192
192 -
 193
193 -
 194
194 -
 195
195 -
 196
196 -
 197
197 -
 198
198 -
 199
199 -
 200
200 -
 201
201 -
 202
202 -
 203
203 -
 204
204 -
 205
205 -
 206
206 -
 207
207 -
 208
208 -
 209
209 -
 210
210 -
211
-
212
-
213
-
214
-
215
-
216
-
217
-
218
-
219
-
220
-
221
-
222
-
223
-
224
-
225
-
226
-
227
 |
 |

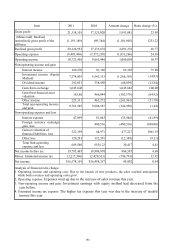
196
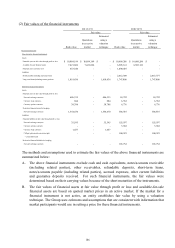
Item 2011 2010 Amount change Ratio change (%)
Gross profit 21,318,101 17,325,020 3,993,081 23.05
(Minus) add: Realized
(unrealized) gross profit of the
affiliates
(1,191,149) (89,344) (1,101,805) 1233.22
Realized gross profit 20,126,952 17,235,676 2,891,276 16.77
Operating expense (9,403,496) (7,572,230) (1,831,266) 24.18
Operating income 10,723,456 9,663,446 1,060,010 10.97
Non-operating income and gain
Interest income 160,270 91,168 69,102 75.80
Investment income (Equity
Method) 7,274,803 8,541,113 (1,266,310) (14.83)
Dividend income 292,051 338,950 (46,899) (13.84)
Gain from exchange 1,645,648 - 1,645,648 100.00
Gain from financial asset
valuation 163,66 466,044 (302,578) (64.92)
Other income 225,311 467,272 (241,961) (51.78)
Total non-operating income
and gain 9,761,549 9,904,547 (142,998) (1.44)
Non-operating expense and loss
Interest expense 47,099 81,045 (33,946) (41.89)
Foreign currency exchange
gain, loss - 400,516 (400,516) (100.00)
Gain on valuation of
financial liabilities, loss 522,198 44,971 477,227 1061.19
Other loss 120,243 132,591 (12,348) (9.31)
Total Non-operating
expense and loss 689,540 659,123 30,417 4.61
Net income before tax 19,795,465 18,908,870 886,595 4.69
Minus: Estimated income tax (3,217,306) (2,420,513) (796,793) 32.92
Net income $16,578,159 $16,488,357 89,802 0.54
Analysis of financial ratio change:
1. Operating income and operating cost: Due to the launch of new products, the sales reached anticipation
while both revenues and operating costs grew.
2. Operating expense: Expenses went up due to the increase of sales revenue this year.
3. Non-operating income and gain: Investment earnings with equity method had decreased from the
year before.
4. Estimated income tax expense: The higher tax expense this year was due to the increase of taxable
income this year.