Asus 2011 Annual Report Download - page 98
Download and view the complete annual report
Please find page 98 of the 2011 Asus annual report below. You can navigate through the pages in the report by either clicking on the pages listed below, or by using the keyword search tool below to find specific information within the annual report.-
 1
1 -
2
-
3
-
4
-
5
-
6
-
7
-
8
-
9
-
10
-
11
-
12
-
13
-
14
-
15
-
16
-
17
-
18
-
19
-
20
-
21
-
22
-
23
-
24
-
25
-
26
-
27
-
28
-
29
-
30
-
31
-
32
-
33
-
34
-
35
-
36
-
37
-
38
-
39
-
40
-
41
-
42
-
43
-
44
-
45
-
46
-
47
-
48
-
49
-
50
-
51
-
52
-
53
-
54
-
55
-
56
-
57
-
58
-
59
-
60
-
61
-
62
-
63
-
64
-
65
-
66
-
67
-
68
-
69
-
70
-
71
-
72
-
73
-
74
-
75
-
76
-
77
-
78
-
79
-
80
-
81
-
82
-
83
-
84
-
85
-
86
-
87
-
 88
88 -
 89
89 -
 90
90 -
 91
91 -
 92
92 -
 93
93 -
 94
94 -
 95
95 -
 96
96 -
 97
97 -
 98
98 -
 99
99 -
 100
100 -
 101
101 -
 102
102 -
 103
103 -
 104
104 -
 105
105 -
 106
106 -
 107
107 -
 108
108 -
109
-
110
-
111
-
112
-
113
-
114
-
115
-
116
-
117
-
118
-
119
-
120
-
121
-
122
-
123
-
124
-
125
-
126
-
127
-
128
-
129
-
130
-
131
-
132
-
133
-
134
-
135
-
136
-
137
-
138
-
139
-
140
-
141
-
142
-
143
-
144
-
145
-
146
-
147
-
148
-
149
-
150
-
151
-
152
-
153
-
154
-
155
-
156
-
157
-
158
-
159
-
160
-
161
-
162
-
163
-
164
-
165
-
166
-
167
-
168
-
169
-
170
-
171
-
172
-
173
-
174
-
175
-
176
-
177
-
178
-
179
-
180
-
181
-
182
-
183
-
184
-
185
-
186
-
187
-
188
-
189
-
190
-
191
-
192
-
193
-
194
-
195
-
196
-
197
-
198
-
199
-
200
-
201
-
202
-
203
-
204
-
205
-
206
-
207
-
208
-
209
-
210
-
211
-
212
-
213
-
214
-
215
-
216
-
217
-
218
-
219
-
220
-
221
-
222
-
223
-
224
-
225
-
226
-
227
 |
 |

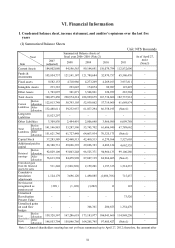
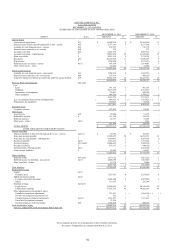
94
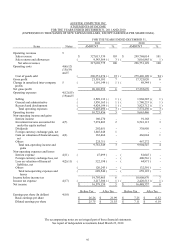
ASUSTEK COMPUTER INC.
BALANCE SHEETS
DECEMBER 31, 2011 AND 2010
(EXPRESSED IN THOUSANDS OF NEW TAIWAN DOLLARS)
DECEMBER 31, 2011
DECEMBER 31, 2010
ASSETS
Notes
AMOUNT
%
AMOUNT
%
The accompanying notes are an integral part of these financial statements.
See report of independent accountants dated March 23, 2012.
Current Assets
Cash and cash equivalents
4(1)
$
16,608,239
9
$
25,414,890
15
Financial assets at fair value through profit or loss - current
4(2)
9,737,303
5
8,137,398
5
Available -for-sale financial assets - current
4(3)
274,792
-
136,793
-
Financial assets carried at cost - current
4(4)
372
-
372
-
Accounts receivable
4(5)
2,669,758
1
9,083,914
6
Accounts receivable - related parties
5
52,847,656
29
41,845,943
25
Other receivables
5
8,251,210
5
2,176,324
1
Inventories
4(6)
20,149,506
11
15,580,297
9
Prepayments
7
1,364,840
1
6,673,156
4
Deferred income tax assets - current
4(17)
907,554
1
1,014,641
1
Other current assets - others
21,466
-
16,066
-
112,832,696
62
110,079,794
66
Funds and Investments
Available -for-sale financial assets - non-current
4(3)
7,068,339
4
6,346,516
4
Financial assets carried at cost - non-current
4(4)
107,579
-
400,520
-
Long-term equity investments accounted for under the equity method
4(7)
58,384,558
32
46,223,721
28
65,560,476
36
52,970,757
32
Property, Plant and Equipment
4(8) and 5
Cost
Land
981,191
1
981,191
1
Buildings
2,312,270
1
2,312,517
1
Instruments and equipment
379,407
-
442,298
-
Other equipment
943,706
1
1,796,127
1
4,616,574
3
5,532,133
3
Less: Accumulated depreciation and impairment
(
948,816
)
(
1
)
(
1,355,422
)
(
1
)
Prepayments for equipment
270,053
-
92,392
-
3,937,811
2
4,269,103
2
Intangible Asset
Computer software
123,425
-
89,987
-
Other Assets
Leased assets
4(9)
95,988
-
97,372
-
Refundable deposits
6
161,799
-
158,972
-
Deferred expenses
25,717
-
56,001
-
Other assets - others
4(10)
-
-
8,614
-
283,504
-
320,959
-
TOTAL ASSETS
$
182,737,912
100
$
167,730,600
100
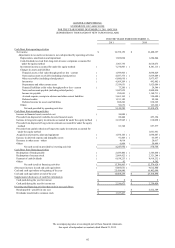
LIABILITIES AND STOCKHOLDERS' EQUITY
Current Liabilities
Financial liabilities at fair value through profit or loss - current
4(2)(11)
$
32,695
-
$
105,895
-
Notes and accounts payable
37,098,952
20
34,291,831
21
Notes and accounts payable - related parties
5
9,068,411
5
9,435,702
6
Income tax payable
4(17)
1,612,235
1
1,316,542
1
Accrued expenses
4(15) and 5
13,244,609
7
9,448,180
6
Receipts in advance
5
573,677
1
648,550
-
Current portion of bonds payable
4(11)
-
-
2,412,309
1
Other currents liabilities
5
59,295
-
60,951
-
61,689,874
34
57,719,960
35
Other Liabilities
Deferred credits
4(7) and 5
3,279,112
2
2,051,225
1
Deferred income tax liabilities- non-current
4(17)
2,808,698
1
1,903,869
1
Other Liabilities - Others
11,978
-
11,886
-
6,099,788
3
3,966,980
2
Total liabilities
67,789,662
37
61,686,940
37
Stockholders' Equity
Capital
4(13)
Common stock
7,527,603
4
6,270,166
4
Additional paid-in capital
4(14)
Common stock share premium
4,284,888
2
4,205,880
2
Others
377,667
-
276,244
-
Retained earnings
4(15)(17)
Legal reserve
21,806,955
12
20,158,120
12
Undistributed earnings
77,293,325
42
74,802,015
45
Other adjustments to stockholders' equity
Cumulative translation adjustments
715,457
1
(
1,066,766
)
(
1
)
Net loss not recognized as pension cost
122
-
11
-
Unrealized gain on financial instruments
4(3)(7)
1,514,237
1
1,197,335
1
Unrealized revaluation increment
73,526
-
-
-
Unrealized gain on cash flow hedges
4(7)
1,354,470
1
200,655
-
Total stockholders' equity
114,948,250
63
106,043,660
63
TOTAL LIABILITIES AND STOCKHOLDERS' EQUITY
$
182,737,912
100
$
167,730,600
100