Asus 2011 Annual Report Download - page 90
Download and view the complete annual report
Please find page 90 of the 2011 Asus annual report below. You can navigate through the pages in the report by either clicking on the pages listed below, or by using the keyword search tool below to find specific information within the annual report.-
 1
1 -
2
-
3
-
4
-
5
-
6
-
7
-
8
-
9
-
10
-
11
-
12
-
13
-
14
-
15
-
16
-
17
-
18
-
19
-
20
-
21
-
22
-
23
-
24
-
25
-
26
-
27
-
28
-
29
-
30
-
31
-
32
-
33
-
34
-
35
-
36
-
37
-
38
-
39
-
40
-
41
-
42
-
43
-
44
-
45
-
46
-
47
-
48
-
49
-
50
-
51
-
52
-
53
-
54
-
55
-
56
-
57
-
58
-
59
-
60
-
61
-
62
-
63
-
64
-
65
-
66
-
67
-
68
-
69
-
70
-
71
-
72
-
73
-
74
-
75
-
76
-
77
-
78
-
79
-
 80
80 -
 81
81 -
 82
82 -
 83
83 -
 84
84 -
 85
85 -
 86
86 -
 87
87 -
 88
88 -
 89
89 -
 90
90 -
 91
91 -
 92
92 -
 93
93 -
 94
94 -
 95
95 -
 96
96 -
 97
97 -
 98
98 -
 99
99 -
 100
100 -
101
-
102
-
103
-
104
-
105
-
106
-
107
-
108
-
109
-
110
-
111
-
112
-
113
-
114
-
115
-
116
-
117
-
118
-
119
-
120
-
121
-
122
-
123
-
124
-
125
-
126
-
127
-
128
-
129
-
130
-
131
-
132
-
133
-
134
-
135
-
136
-
137
-
138
-
139
-
140
-
141
-
142
-
143
-
144
-
145
-
146
-
147
-
148
-
149
-
150
-
151
-
152
-
153
-
154
-
155
-
156
-
157
-
158
-
159
-
160
-
161
-
162
-
163
-
164
-
165
-
166
-
167
-
168
-
169
-
170
-
171
-
172
-
173
-
174
-
175
-
176
-
177
-
178
-
179
-
180
-
181
-
182
-
183
-
184
-
185
-
186
-
187
-
188
-
189
-
190
-
191
-
192
-
193
-
194
-
195
-
196
-
197
-
198
-
199
-
200
-
201
-
202
-
203
-
204
-
205
-
206
-
207
-
208
-
209
-
210
-
211
-
212
-
213
-
214
-
215
-
216
-
217
-
218
-
219
-
220
-
221
-
222
-
223
-
224
-
225
-
226
-
227
 |
 |
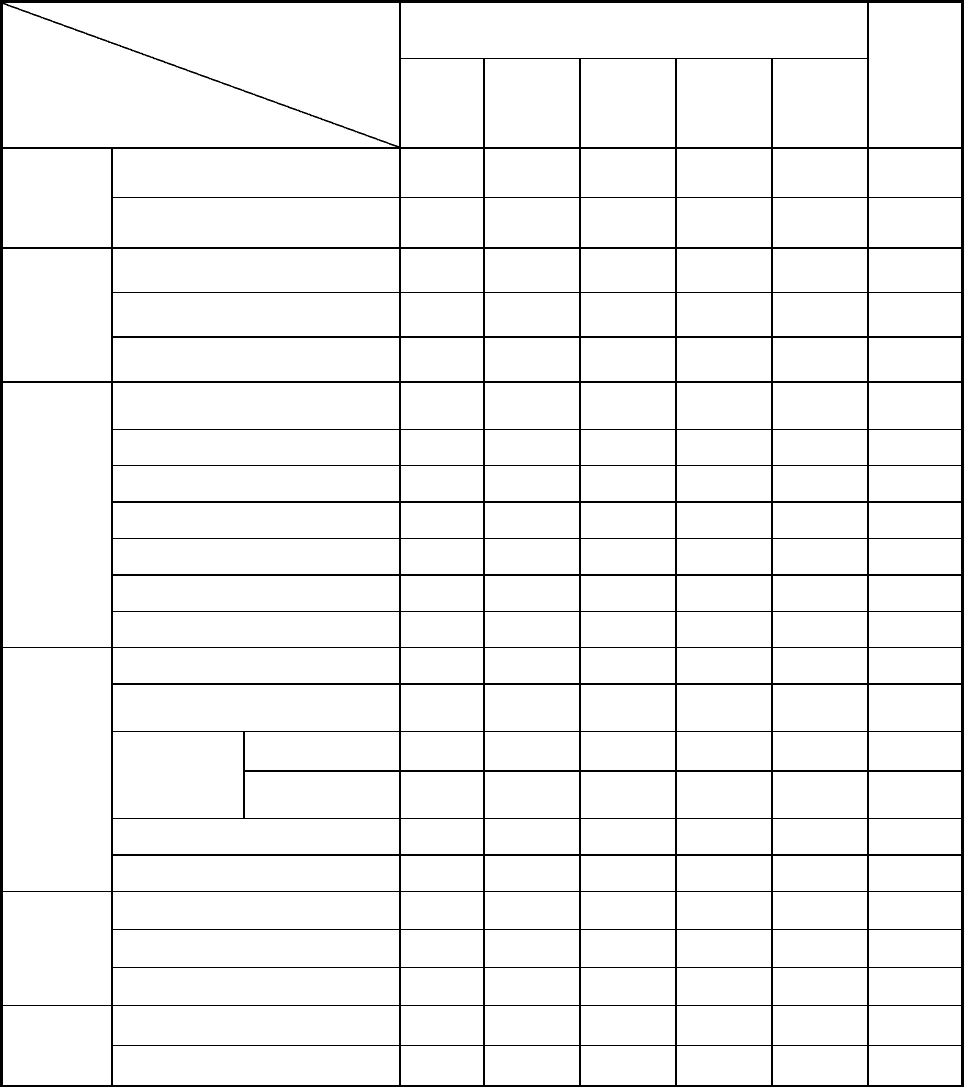
86
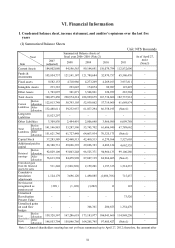
II. Financial analysis in the past five years
Year
Item (Note 2)
Financial analysis in the past five years As of
April 27,
2012
(Note 5)
2007
(adjusted) 2008 2009 2010
(Note 9) 2011
Financial
structure
(%)
Ratio of liabilities to assets 46.97 24.16 24.35 36.78 37.10 -
Ratio of long-term capital to fixed
assets 2040.88 3,550.99 4,052.73 2,483.98 2,919.09 -
Solvency
(%)
Current ratio (%) 150.80 185.45 187.28 190.71 182.90 -
Quick ratio (%) 105.90 126.91 154.53 150.40 146.56 -
Times interest earned ratio 62.11 66.82 127.32 234.31 421.29 -
Operating
ability
Account receivable turnover
(times) 5.56 3.38 5.41 6.04 5.96 -
Days sales in accounts receivable 65.64 107.98 67.46 60.43 61.24 -
Inventory turnover (times) 8.47 5.43 9.26 15.99 15.28 -
Account payable turnover (times) 5.50 4.41 7.20 6.94 6.59 -
Average days in sales 43.09 67.21 39.41 22.86 23.88 -
Fixed assts turnover (times) 68.74 52.93 54.43 69.51 80.67 -
Total assets turnover (times) 1.96 1.13 1.02 1.77 1.74 -
Profitability
Ratio of return on total assets (%) 9.24 6.41 5.60 8.35 9.48 -
Ratio of return on shareholders’
equity (%) 18.78 10.08 7.33 11.81 15.00 -
Ratio to issued
capital stock (%)
Operating income 43.00 16.93 8.35 154.12 142.46 -
Income before tax 88.65 48.41 30.19 301.57 262.97 -
Profit ratio (%) 4.62 6.60 5.37 5.56 5.22 -
Earnings per share ($) 7.43 3.88 2.94 6.32 21.99 -
Cash flow
(%)
Cash flow ratio (%) 9.44 34.82 46.17 36.41 14.83 -
Cash flow adequacy ratio (%) 26.37 31.01 51.68 85.46 122.16 -
Cash reinvestment ratio (%) 3.54 4.86 9.01 10.87 0.42 -
Balance Degree of operating leverage 9.44 1.26 2.60 1.54 1.61 -
Degree of financial leverage 26.37 1.05 1.03 1.01 1.00 -