Asus 2011 Annual Report Download - page 101
Download and view the complete annual report
Please find page 101 of the 2011 Asus annual report below. You can navigate through the pages in the report by either clicking on the pages listed below, or by using the keyword search tool below to find specific information within the annual report.-
 1
1 -
2
-
3
-
4
-
5
-
6
-
7
-
8
-
9
-
10
-
11
-
12
-
13
-
14
-
15
-
16
-
17
-
18
-
19
-
20
-
21
-
22
-
23
-
24
-
25
-
26
-
27
-
28
-
29
-
30
-
31
-
32
-
33
-
34
-
35
-
36
-
37
-
38
-
39
-
40
-
41
-
42
-
43
-
44
-
45
-
46
-
47
-
48
-
49
-
50
-
51
-
52
-
53
-
54
-
55
-
56
-
57
-
58
-
59
-
60
-
61
-
62
-
63
-
64
-
65
-
66
-
67
-
68
-
69
-
70
-
71
-
72
-
73
-
74
-
75
-
76
-
77
-
78
-
79
-
80
-
81
-
82
-
83
-
84
-
85
-
86
-
87
-
88
-
89
-
90
-
 91
91 -
 92
92 -
 93
93 -
 94
94 -
 95
95 -
 96
96 -
 97
97 -
 98
98 -
 99
99 -
 100
100 -
 101
101 -
 102
102 -
 103
103 -
 104
104 -
 105
105 -
 106
106 -
 107
107 -
 108
108 -
 109
109 -
 110
110 -
 111
111 -
112
-
113
-
114
-
115
-
116
-
117
-
118
-
119
-
120
-
121
-
122
-
123
-
124
-
125
-
126
-
127
-
128
-
129
-
130
-
131
-
132
-
133
-
134
-
135
-
136
-
137
-
138
-
139
-
140
-
141
-
142
-
143
-
144
-
145
-
146
-
147
-
148
-
149
-
150
-
151
-
152
-
153
-
154
-
155
-
156
-
157
-
158
-
159
-
160
-
161
-
162
-
163
-
164
-
165
-
166
-
167
-
168
-
169
-
170
-
171
-
172
-
173
-
174
-
175
-
176
-
177
-
178
-
179
-
180
-
181
-
182
-
183
-
184
-
185
-
186
-
187
-
188
-
189
-
190
-
191
-
192
-
193
-
194
-
195
-
196
-
197
-
198
-
199
-
200
-
201
-
202
-
203
-
204
-
205
-
206
-
207
-
208
-
209
-
210
-
211
-
212
-
213
-
214
-
215
-
216
-
217
-
218
-
219
-
220
-
221
-
222
-
223
-
224
-
225
-
226
-
227
 |
 |

97
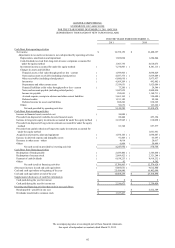
ASUSTEK COMPUTER INC.
STATEMENTS OF CASH FLOWS
FOR THE YEARS ENDED DECEMBER 31, 2011 AND 2010
(EXPRESSED IN THOUSANDS OF NEW TAIWAN DOLLARS)
FOR THE YEARS ENDED DECEMBER 31,
2011
2010
The accompanying notes are an integral part of these financial statements.
See report of independent accountants dated March 23, 2012.
Cash flows from operating activities
Net income
$
16,578,159
$
16,488,357
Adjustments to reconcile net income to net cash provided by operating activities
Depreciation, amortization and impairment
1,509,094
1,284,844
Cash dividends received from long-term investee companies accounted for
under the equity method
1,303,736
4,018,073
Investment income accounted for under the equity method
(
7,274,803
)
(
8,541,113
)
Changes in assets and liabilities
Financial assets at fair value through profit or loss - current
(
1,599,905
)
5,098,429
Notes and accounts receivable (including related parties)
(
4,587,375
)
(
3,839,449
)
Other receivables (including related parties)
(
6,680,610
)
3,873,937
Inventories
(
4,569,209
)
(
492,802
)
Prepayments and other current assets
5,359,651
(
1,925,006
)
Financial liabilities at fair value through profit or loss - current
(
73,200
)
(
28,546
)
Notes and accounts payable (including related parties)
3,047,839
5,800,854
Income tax payable
295,693
(
1,160,711
)
Accrued expense, receipts in advance and other current liabilities
3,663,165
(
354,680
)
Deferred credits
1,191,149
89,344
Deferred income tax assets and liabilities
888,226
830,365
Others
96,672
(
123,226
)
Net cash provided by operating activities
9,148,282
21,018,670
Cash flows from investing activities
Increase in financial assets carried at cost
(
56,000
)
-
Proceeds from disposal of available-for-sale financial assets
60,444
453,354
Increase in long-term equity investments accounted for under the equity method
(
3,185,945
)
(
610,098
)
Proceeds from disposal of long-term investments accounted for under the equity
method
83,748
857,577
Proceeds from capital reduction of long-term equity investments accounted for
under the equity method
-
1,061,951
Acquisition of property, plant and equipment
(
1,074,166
)
(
1,098,447
)
Increase in deferred expense and intangible assets
(
91,469
)
(
63,697
)
Decrease in other assets - others
8,614
20,617
Others
6,804
(
50,499
)
Net cash (used in) provided by investing activities
(
4,247,970
)
570,758
Cash flows from financing activities
Redemption of bonds payable
(
2,459,400
)
(
1,346,450
)
Redemption of treasury stock
(
2,609,422
)
(
2,321,248
)
Payment of cash dividends
(
8,638,233
)
(
8,918,232
)
Others
92
9,302
Net cash (used in) financing activities
(
13,706,963
)
(
12,576,628
)
(Decrease) increase in cash and cash equivalents
(
8,806,651
)
9,012,800
Cash and cash equivalents at beginning of the year
25,414,890
16,402,090
Cash and cash equivalents at end of the year
$
16,608,239
$
25,414,890
Supplemental disclosures of cash flow information
Cash paid during the year for interest
$
8
$
5
Cash paid during the year for income tax
$
2,336,873
$
2,750,859
Investing and financing activities that result in non-cash flows:
Bonds payable - payable in one year
$
-
$
2,412,309
Dividends transferred to common stock
$
1,357,437
$
-