Asus 2011 Annual Report Download - page 199
Download and view the complete annual report
Please find page 199 of the 2011 Asus annual report below. You can navigate through the pages in the report by either clicking on the pages listed below, or by using the keyword search tool below to find specific information within the annual report.-
 1
1 -
2
-
3
-
4
-
5
-
6
-
7
-
8
-
9
-
10
-
11
-
12
-
13
-
14
-
15
-
16
-
17
-
18
-
19
-
20
-
21
-
22
-
23
-
24
-
25
-
26
-
27
-
28
-
29
-
30
-
31
-
32
-
33
-
34
-
35
-
36
-
37
-
38
-
39
-
40
-
41
-
42
-
43
-
44
-
45
-
46
-
47
-
48
-
49
-
50
-
51
-
52
-
53
-
54
-
55
-
56
-
57
-
58
-
59
-
60
-
61
-
62
-
63
-
64
-
65
-
66
-
67
-
68
-
69
-
70
-
71
-
72
-
73
-
74
-
75
-
76
-
77
-
78
-
79
-
80
-
81
-
82
-
83
-
84
-
85
-
86
-
87
-
88
-
89
-
90
-
91
-
92
-
93
-
94
-
95
-
96
-
97
-
98
-
99
-
100
-
101
-
102
-
103
-
104
-
105
-
106
-
107
-
108
-
109
-
110
-
111
-
112
-
113
-
114
-
115
-
116
-
117
-
118
-
119
-
120
-
121
-
122
-
123
-
124
-
125
-
126
-
127
-
128
-
129
-
130
-
131
-
132
-
133
-
134
-
135
-
136
-
137
-
138
-
139
-
140
-
141
-
142
-
143
-
144
-
145
-
146
-
147
-
148
-
149
-
150
-
151
-
152
-
153
-
154
-
155
-
156
-
157
-
158
-
159
-
160
-
161
-
162
-
163
-
164
-
165
-
166
-
167
-
168
-
169
-
170
-
171
-
172
-
173
-
174
-
175
-
176
-
177
-
178
-
179
-
180
-
181
-
182
-
183
-
184
-
185
-
186
-
187
-
188
-
 189
189 -
 190
190 -
 191
191 -
 192
192 -
 193
193 -
 194
194 -
 195
195 -
 196
196 -
 197
197 -
 198
198 -
 199
199 -
 200
200 -
 201
201 -
 202
202 -
 203
203 -
 204
204 -
 205
205 -
 206
206 -
 207
207 -
 208
208 -
 209
209 -
210
-
211
-
212
-
213
-
214
-
215
-
216
-
217
-
218
-
219
-
220
-
221
-
222
-
223
-
224
-
225
-
226
-
227
 |
 |
195
195
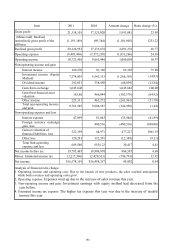
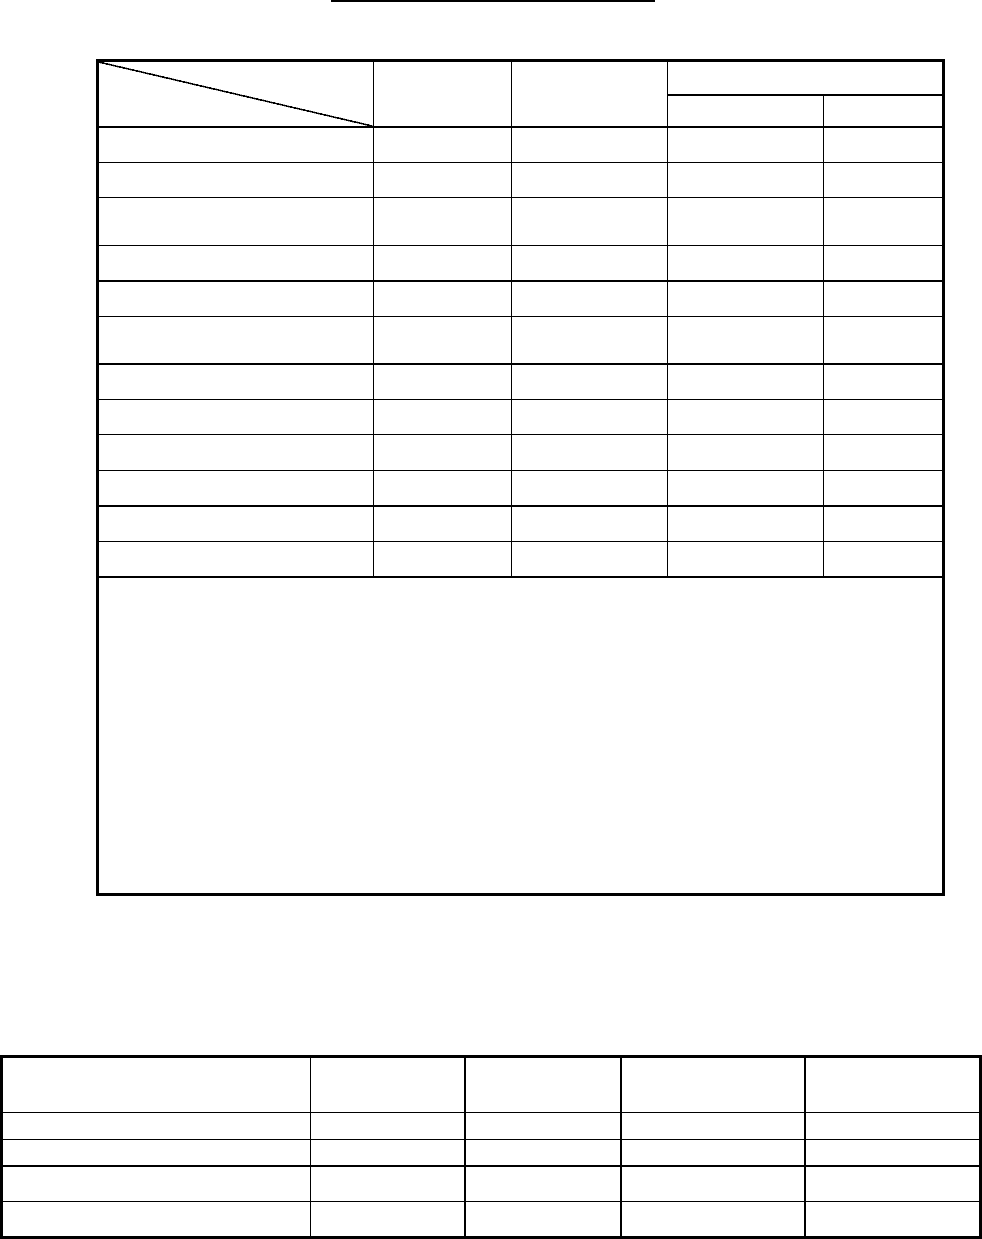
VII. Review of financial position, management performance and
risk management
I. Analysis of financial position
Comparison of Financial Position
Unit: NT$ thousands
Year
Item
2011 2010 Difference
Amount %
Current assets 112,832,696 110,079,794 2,752,902 2.50
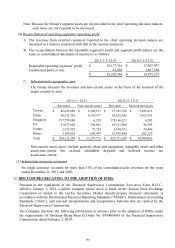
Fixed assets 3,937,811 4,269,103 (331,292) (7.76)
Long-term investment and
other assets 65,967,405 53,381,703 12,585,702 23.58
Total assets 182,737,912 167,730,600 15,007,312 8.95
Current liabilities 61,689,874 57,719,960 3,969,914 6.88
Long-term liabilities and
other liabilities 6,099,788 3,966,980 2,132,808 53.76
Total liabilities 67,789,662 61,686,940 6,102,722 9.89
Capital stock 7,527,603 6,270,166 1,257,437 20.05
Additional paid-in capital 4,662,555 4,482,124 180,431 4.03
Retained earnings 99,100,280 94,960,135 4,140,145 4.36
Adjustments 3,657,812 331,235 3,326,577 1004.30
Total Shareholders’ Equity 114,948,250 106,043,660 8,904,590 8.40
Analysis of financial ratio change:
1. Current assets: Due to the increase in revenue growth, the accounts receivable generated
from sales of goods and net inventory.
2. Long-term investment, intangible assets, and other assets: Due to the increase in long-term
investment.
3. Current liabilities: Due to the rise in revenue growth, accounts payable and accrued
expenses from relevant stock preparation.
4. Long-term liabilities and other liabilities: Due to the increase in deferred credits and
deferred tax liability.
5. Adjustments: Due to the recognition of rise in unrealized gains and losses from cash flow
hedging for subsidiaries and investment to subsidiaries overseas, and the devaluation o
f
TWD against the U.S. dollar and the rise in cumulative translation adjustment amount.
II. Business performance
(I) Comparison of business performance
Unit: NT$ thousands
Item 2011 2010 Amount change Ratio change (%)
Total operating income $327,013,339 $299,768,014 27,245,325 9.09
Minus: Sales return and discount (9,343,564) (3,016,885) (6,326,679) 209.71
Net operating income 317,669,775 296,751,129 20,918,646 7.05
Operating cost (296,351,674) (279,426,109) (16,925,565) 6.06