Asus 2011 Annual Report Download - page 136
Download and view the complete annual report
Please find page 136 of the 2011 Asus annual report below. You can navigate through the pages in the report by either clicking on the pages listed below, or by using the keyword search tool below to find specific information within the annual report.-
 1
1 -
2
-
3
-
4
-
5
-
6
-
7
-
8
-
9
-
10
-
11
-
12
-
13
-
14
-
15
-
16
-
17
-
18
-
19
-
20
-
21
-
22
-
23
-
24
-
25
-
26
-
27
-
28
-
29
-
30
-
31
-
32
-
33
-
34
-
35
-
36
-
37
-
38
-
39
-
40
-
41
-
42
-
43
-
44
-
45
-
46
-
47
-
48
-
49
-
50
-
51
-
52
-
53
-
54
-
55
-
56
-
57
-
58
-
59
-
60
-
61
-
62
-
63
-
64
-
65
-
66
-
67
-
68
-
69
-
70
-
71
-
72
-
73
-
74
-
75
-
76
-
77
-
78
-
79
-
80
-
81
-
82
-
83
-
84
-
85
-
86
-
87
-
88
-
89
-
90
-
91
-
92
-
93
-
94
-
95
-
96
-
97
-
98
-
99
-
100
-
101
-
102
-
103
-
104
-
105
-
106
-
107
-
108
-
109
-
110
-
111
-
112
-
113
-
114
-
115
-
116
-
117
-
118
-
119
-
120
-
121
-
122
-
123
-
124
-
125
-
 126
126 -
 127
127 -
 128
128 -
 129
129 -
 130
130 -
 131
131 -
 132
132 -
 133
133 -
 134
134 -
 135
135 -
 136
136 -
 137
137 -
 138
138 -
 139
139 -
 140
140 -
 141
141 -
 142
142 -
 143
143 -
 144
144 -
 145
145 -
 146
146 -
147
-
148
-
149
-
150
-
151
-
152
-
153
-
154
-
155
-
156
-
157
-
158
-
159
-
160
-
161
-
162
-
163
-
164
-
165
-
166
-
167
-
168
-
169
-
170
-
171
-
172
-
173
-
174
-
175
-
176
-
177
-
178
-
179
-
180
-
181
-
182
-
183
-
184
-
185
-
186
-
187
-
188
-
189
-
190
-
191
-
192
-
193
-
194
-
195
-
196
-
197
-
198
-
199
-
200
-
201
-
202
-
203
-
204
-
205
-
206
-
207
-
208
-
209
-
210
-
211
-
212
-
213
-
214
-
215
-
216
-
217
-
218
-
219
-
220
-
221
-
222
-
223
-
224
-
225
-
226
-
227
 |
 |

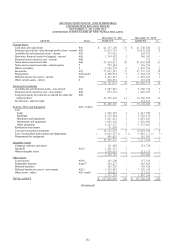
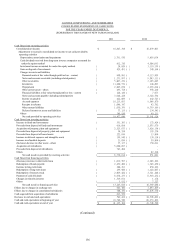
132
ASUSTEK COMPUTER INC. AND SUBSIDIARIES
CONSOLIDATED BALANCE SHEETS
DECEMBER 31, 2011 AND 2010
(EXPRESSED IN THOUSANDS OF NEW TAIWAN DOLLARS)
December
31
,
2011
December
31
,
2010
ASSETS
Notes
AMOUNT
%
AMOUNT
%
Current Assets
Cash and cash equivalents
4(1)
$41,197,108 19 $41,746,540 21
Financial assets at fair value through profit or loss
-
current
4(2)
11,610,195 510,641,206 6
Available
-
for
-
sale financial assets
-
current
4(3)
333,923 -136,793 -
Derivative financial assets for hedging
-
current
4(5)
1,354,470 1386,387 -
Financial assets carried at cost
-
current
4(4)
372 -372 -
Notes and accounts receivable
4(6)
43,104,012 20 41,641,686 21
Notes and accounts receivable
-
related parties
5
558,248 -398,299 -
Other receivables
5
9,096,576 43,807,594 2
Inventories
4(7)
57,897,547 27 45,797,185 24
Prepayments
4(16) and 7
4,266,674 27,148,143 4
Deferred income tax assets
-
current
4(21)
2,107,897 11,638,031 1
Other current assets
-
others
6
604,051 -107,939 -
172,131,073 79 153,450,175 79
Funds and Investments
Available
-
for
-
sale financial assets
-
non
-
current
4(3)
7,087,683 36,366,348 3
Financial assets carried at cost
-
non
-
current
4(4)
653,172 -1,090,035 1
Long-term equity investments accounted for under the
equity method
4(8)
22,745,490 11 22,360,166 11
Investments
-
land use right
- - 324,471 -
30,486,345 14 30,141,020 15
Property, Plant and
Equipment
4(9), 5 and 6
Cost
Land
1,998,367 11,443,596 1
Buildings
6,170,284 35,528,478 3
Machinery and equipment
2,941,414 12,652,243 1
Instruments and equipment
1,663,102 11,601,962 1
Other equipment
3,247,137 23,775,647 2
Revaluation increments
91,906 - - -
Cost and revaluation increments
16,112,210 815,001,926 8
Less: Accumulated depreciation and impairment
(
6,043,557
)
(
3
)
(
5,885,111
)
(
3
)
Prepayments for equipment
440,870 -161,003 -
10,509,523 59,277,818 5
Intangible Assets
Computer software and others
151,456 -153,738 -
Goodwill
4(12)
1,181,373 1 - -
Other intangible assets
1,036,925 -213,331 -
2,369,754 1367,069 -
Other Assets
Leased assets
4(10)
143,108 -137,316 -
Refundable deposits
6 and 7
290,273 -265,695 -
Deferred expenses
162,765 -198,928 -
Deferred income tax assets
-
non
-
current
4(21)
1,582,487 11,150,216 1
Other assets
-
others
4(11) and 6
194,622 -117,951 -
2,373,255 11,870,106 1
TOTAL ASSETS
$217,869,950 100 $195,106,188 100
(Continued)