Asus 2011 Annual Report Download - page 100
Download and view the complete annual report
Please find page 100 of the 2011 Asus annual report below. You can navigate through the pages in the report by either clicking on the pages listed below, or by using the keyword search tool below to find specific information within the annual report.-
 1
1 -
2
-
3
-
4
-
5
-
6
-
7
-
8
-
9
-
10
-
11
-
12
-
13
-
14
-
15
-
16
-
17
-
18
-
19
-
20
-
21
-
22
-
23
-
24
-
25
-
26
-
27
-
28
-
29
-
30
-
31
-
32
-
33
-
34
-
35
-
36
-
37
-
38
-
39
-
40
-
41
-
42
-
43
-
44
-
45
-
46
-
47
-
48
-
49
-
50
-
51
-
52
-
53
-
54
-
55
-
56
-
57
-
58
-
59
-
60
-
61
-
62
-
63
-
64
-
65
-
66
-
67
-
68
-
69
-
70
-
71
-
72
-
73
-
74
-
75
-
76
-
77
-
78
-
79
-
80
-
81
-
82
-
83
-
84
-
85
-
86
-
87
-
88
-
89
-
 90
90 -
 91
91 -
 92
92 -
 93
93 -
 94
94 -
 95
95 -
 96
96 -
 97
97 -
 98
98 -
 99
99 -
 100
100 -
 101
101 -
 102
102 -
 103
103 -
 104
104 -
 105
105 -
 106
106 -
 107
107 -
 108
108 -
 109
109 -
 110
110 -
111
-
112
-
113
-
114
-
115
-
116
-
117
-
118
-
119
-
120
-
121
-
122
-
123
-
124
-
125
-
126
-
127
-
128
-
129
-
130
-
131
-
132
-
133
-
134
-
135
-
136
-
137
-
138
-
139
-
140
-
141
-
142
-
143
-
144
-
145
-
146
-
147
-
148
-
149
-
150
-
151
-
152
-
153
-
154
-
155
-
156
-
157
-
158
-
159
-
160
-
161
-
162
-
163
-
164
-
165
-
166
-
167
-
168
-
169
-
170
-
171
-
172
-
173
-
174
-
175
-
176
-
177
-
178
-
179
-
180
-
181
-
182
-
183
-
184
-
185
-
186
-
187
-
188
-
189
-
190
-
191
-
192
-
193
-
194
-
195
-
196
-
197
-
198
-
199
-
200
-
201
-
202
-
203
-
204
-
205
-
206
-
207
-
208
-
209
-
210
-
211
-
212
-
213
-
214
-
215
-
216
-
217
-
218
-
219
-
220
-
221
-
222
-
223
-
224
-
225
-
226
-
227
 |
 |

96
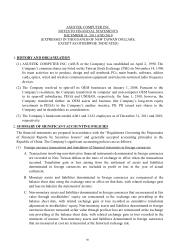
ASUSTEK COMPUTER INC.
STATEMENTS OF CHANGES IN STOCKHOLDERS’ EQUITY
FOR THE YEARS ENDED DECEMBER 31, 2011 AND 2010
(EXPRESSED IN THOUSANDS OF NEW TAIWAN DOLLARS)
Retained Earnings
Other Adjustments to Stockholders’ Equity
Common stock
Additional
paid-in capital
Legal reserve
Undistributed
earnings
Cumulative
translation
adjustments
Net loss not
recognized as
pension cost
Unrealized gain
on financial
instruments
Unrealized
revaluation
increment
Unrealized gain
on cash flow
hedges
Treasury Stock
Total
The accompanying notes are an integral part of these financial statements.
See report of independent accountants dated March 23, 2012.
2010
Balance at January 1, 2010
$ 42,467,775
$ 30,237,586
$ 18,910,213
$ 77,615,158
$ 1,490,885
(
$ 3,202
)
$ 2,159,201
$ -
$ 306,361
$ -
$ 173,183,977
Appropriations of 2009 earnings (Note 4(15))
Legal reserve
-
-
1,247,907
(
1,247,907
)
-
-
-
-
-
-
-
Cash dividends
-
-
-
(
8,918,232
)
-
-
-
-
-
-
(
8,918,232
)
Effect of adjustments to spin off and capital
reduction
(
36,097,609
)
(
25,798,854
)
-
(
6,983,398
)
(
99,230
)
2,402
(
1,221,037
)
-
-
-
(
70,197,726
)
Effect of changes in ownership percentage of
investee companies' net stockholders' equity
-
102,759
-
-
-
779
(
364,194
)
-
(
105,706
)
-
(
366,362
)
Effect of disposal of long-term investments
accounted for under the equity method
-
(
24,075
)
-
-
(
1,342
)
32
(
16,379
)
-
-
-
(
41,764
)
Dividends on shares held in trust paid to
employees
-
31,287
-
-
-
-
-
-
-
-
31,287
Foreign currency translation adjustments
-
-
-
-
(
2,457,079
)
-
-
-
-
-
(
2,457,079
)
Effect of changes in valuation of
available-for-sale financial assets
-
-
-
-
-
-
639,744
-
-
-
639,744
Purchase of treasury stock
-
-
-
-
-
-
-
-
-
(
2,321,248
)
(
2,321,248
)
Transfer of treasury stock
-
-
-
(
399
)
-
-
-
-
-
3,105
2,706
Retirement of treasury stock
(
100,000
)
(
66,579
)
-
(
2,151,564
)
-
-
-
-
-
2,318,143
-
Net income for 2010
-
-
-
16,488,357
-
-
-
-
-
-
16,488,357
Balance at December 31, 2010
$ 6,270,166
$ 4,482,124
$ 20,158,120
$ 74,802,015
(
$ 1,066,766
)
$ 11
$ 1,197,335
$ -
$ 200,655
$ -
$ 106,043,660
2011
Balance at January 1, 2011
$ 6,270,166
$ 4,482,124
$ 20,158,120
$ 74,802,015
(
$ 1,066,766
)
$ 11
$ 1,197,335
$ -
$ 200,655
$ -
$ 106,043,660
Appropriations of 2010 earnings (Note4(15))
Legal reserve
-
-
1,648,835
(
1,648,835
)
-
-
-
-
-
-
-
Dividends transferred to common stock
1,357,437
-
-
(
1,357,437
)
-
-
-
-
-
-
-
Cash dividends
-
-
-
(
8,638,233
)
-
-
-
-
-
-
(
8,638,233
)
Effect of changes in ownership percentage of
investee companies' net stockholders' equity
-
102,650
-
-
-
111
(
204,819
)
73,526
1,153,815
-
1,125,283
Effect of disposal of long-term investments
accounted for under the equity method
-
(
1,227
)
-
-
23
-
-
-
-
-
(
1,204
)
Dividends on shares held in trust paid to
employees
-
130,595
-
-
-
-
-
-
-
-
130,595
Dividends on shares held in trust transferred for
increasing in long-term equity investments
accounted for under the equity method
-
15,491
-
-
-
-
-
-
-
-
15,491
Foreign currency translation adjustments
-
-
-
-
1,782,200
-
-
-
-
-
1,782,200
Effect of changes in valuation of
available-for-sale financial assets
-
-
-
-
-
-
521,721
-
-
-
521,721
Purchase of treasury stock
-
-
-
-
-
-
-
-
-
(
2,609,422
)
(
2,609,422
)
Retirement of treasury stock
(
100,000
)
(
67,078
)
-
(
2,442,344
)
-
-
-
-
-
2,609,422
-
Net income for 2011
-
-
-
16,578,159
-
-
-
-
-
-
16,578,159
Balance at December 31, 2011
$ 7,527,603
$ 4,662,555
$ 21,806,955
$ 77,293,325
$ 715,457
$ 122
$ 1,514,237
$ 73,526
$ 1,354,470
$ -
$ 114,948,250