Asus 2011 Annual Report Download - page 140
Download and view the complete annual report
Please find page 140 of the 2011 Asus annual report below. You can navigate through the pages in the report by either clicking on the pages listed below, or by using the keyword search tool below to find specific information within the annual report.-
 1
1 -
2
-
3
-
4
-
5
-
6
-
7
-
8
-
9
-
10
-
11
-
12
-
13
-
14
-
15
-
16
-
17
-
18
-
19
-
20
-
21
-
22
-
23
-
24
-
25
-
26
-
27
-
28
-
29
-
30
-
31
-
32
-
33
-
34
-
35
-
36
-
37
-
38
-
39
-
40
-
41
-
42
-
43
-
44
-
45
-
46
-
47
-
48
-
49
-
50
-
51
-
52
-
53
-
54
-
55
-
56
-
57
-
58
-
59
-
60
-
61
-
62
-
63
-
64
-
65
-
66
-
67
-
68
-
69
-
70
-
71
-
72
-
73
-
74
-
75
-
76
-
77
-
78
-
79
-
80
-
81
-
82
-
83
-
84
-
85
-
86
-
87
-
88
-
89
-
90
-
91
-
92
-
93
-
94
-
95
-
96
-
97
-
98
-
99
-
100
-
101
-
102
-
103
-
104
-
105
-
106
-
107
-
108
-
109
-
110
-
111
-
112
-
113
-
114
-
115
-
116
-
117
-
118
-
119
-
120
-
121
-
122
-
123
-
124
-
125
-
126
-
127
-
128
-
129
-
 130
130 -
 131
131 -
 132
132 -
 133
133 -
 134
134 -
 135
135 -
 136
136 -
 137
137 -
 138
138 -
 139
139 -
 140
140 -
 141
141 -
 142
142 -
 143
143 -
 144
144 -
 145
145 -
 146
146 -
 147
147 -
 148
148 -
 149
149 -
 150
150 -
151
-
152
-
153
-
154
-
155
-
156
-
157
-
158
-
159
-
160
-
161
-
162
-
163
-
164
-
165
-
166
-
167
-
168
-
169
-
170
-
171
-
172
-
173
-
174
-
175
-
176
-
177
-
178
-
179
-
180
-
181
-
182
-
183
-
184
-
185
-
186
-
187
-
188
-
189
-
190
-
191
-
192
-
193
-
194
-
195
-
196
-
197
-
198
-
199
-
200
-
201
-
202
-
203
-
204
-
205
-
206
-
207
-
208
-
209
-
210
-
211
-
212
-
213
-
214
-
215
-
216
-
217
-
218
-
219
-
220
-
221
-
222
-
223
-
224
-
225
-
226
-
227
 |
 |

136
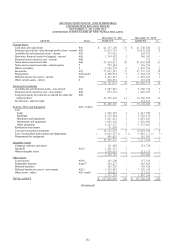
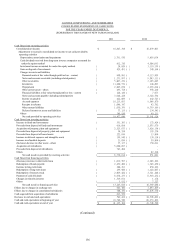
ASUSTEK COMPUTER INC. AND SUBSIDIARIES
CONSOLIDATED STATEMENTS OF CASH FLOWS
FOR THE YEARS ENDED DECEMBER 31,
(EXPRESSED IN THOUSANDS OF NEW TAIWAN DOLLARS)
2011 2010
Cash flows from operating activities
Consolidated net income $16,847,398 $18,039,603
Adjustments to reconcile consolidated net income to net cash provided by
operating activities
Depreciation, amortization and impairment 2,791,970 5,836,834
Cash dividends received from long-term investee companies accounted for
under the equity method 812,310 4,008,093
Investment income accounted for under the equity method (24,826 ) ( 1,110,159 )
Gain on disposal of investments (429,491 ) ( 540,364 )
Changes in assets and liabilities
Financial assets at fair value through profit or loss - current (890,981 )4,315,909
Notes and accounts receivable (including related parties) (1,171,997 ) ( 9,043,111 )
Other receivables (5,867,219 )3,105,645
Inventories (11,800,519 )148,603
Prepayments 2,885,078 (2,276,614 )
Other current assets - others (495,778 )958,210
Financial liabilities at fair value through profit or loss - current (228,126 )7,073
Notes and accounts payable (including related parties) 3,046,228 2,328,794
Income tax payable 422,609 (442,723 )
Accrued expenses 10,215,093 9,066,870
Receipts in advance 1,046,147 42,762
Other current liabilities 1,050,359 (8,759,169 )
Deferred income tax assets and liabilities (77,135 ) ( 234,543 )
Others 345,926 90,211
Net cash provided by operating activities 18,477,046 25,541,924
Cash flows from investing activities
Increase in funds and investments (551,383 ) ( 172,424 )
Proceeds from disposal of funds and investments 616,098 2,075,970
Acquisition of property, plant and equipment (2,525,073 ) ( 1,628,158 )
Proceeds from disposal of property, plant and equipment 58,554 303,178
Proceeds from disposal of leased assets 222,616 13,898
Increase in deferred expenses and intangible assets (199,940 ) ( 130,334 )
Increase in refundable deposits (21,656 ) ( 50,898 )
(Increase) decrease in other assets - others (77,137 )150,611
Acquisition of subsidiaries (5,000,097 ) -
Proceeds from disposal of subsidiaries 747,404 -
Others -89,198
Net cash (used in) provided by investing activities (6,730,614 )651,041
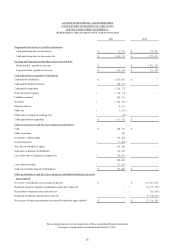
Cash flows from financing activities
(Decrease) increase in short-term loans (1,039,507 )2,286,302
Redemption of bonds payable (2,459,400 ) ( 1,346,450 )
Increase in long-term loans 288,393 850,102
Redemption of long-term loans (299,986 ) ( 1,128,667 )
Redemption of treasury stock (2,609,422 ) ( 2,321,248 )
Payment of cash dividends (8,638,233 ) ( 8,918,232 )
Changes in minority interests 1,519,071 1,178
Others (5,932 )7,327
Net cash (used in) financing activities (13,245,016 ) ( 10,569,688 )
Effects due to changes in exchange rate 641,780 (1,053,209 )
Effects due to changes in consolidated subsidiaries (306,150 ) ( 39,076,730 )
Cash acquired from acquisition of subsidiaries 613,522 -
Decrease in cash and cash equivalents (549,432 ) ( 24,506,662 )
Cash and cash equivalents at beginning of year 41,746,540 66,253,202
Cash and cash equivalents at end of year $41,197,108 $41,746,540
(Continued)