Asus 2011 Annual Report Download - page 194
Download and view the complete annual report
Please find page 194 of the 2011 Asus annual report below. You can navigate through the pages in the report by either clicking on the pages listed below, or by using the keyword search tool below to find specific information within the annual report.-
 1
1 -
2
-
3
-
4
-
5
-
6
-
7
-
8
-
9
-
10
-
11
-
12
-
13
-
14
-
15
-
16
-
17
-
18
-
19
-
20
-
21
-
22
-
23
-
24
-
25
-
26
-
27
-
28
-
29
-
30
-
31
-
32
-
33
-
34
-
35
-
36
-
37
-
38
-
39
-
40
-
41
-
42
-
43
-
44
-
45
-
46
-
47
-
48
-
49
-
50
-
51
-
52
-
53
-
54
-
55
-
56
-
57
-
58
-
59
-
60
-
61
-
62
-
63
-
64
-
65
-
66
-
67
-
68
-
69
-
70
-
71
-
72
-
73
-
74
-
75
-
76
-
77
-
78
-
79
-
80
-
81
-
82
-
83
-
84
-
85
-
86
-
87
-
88
-
89
-
90
-
91
-
92
-
93
-
94
-
95
-
96
-
97
-
98
-
99
-
100
-
101
-
102
-
103
-
104
-
105
-
106
-
107
-
108
-
109
-
110
-
111
-
112
-
113
-
114
-
115
-
116
-
117
-
118
-
119
-
120
-
121
-
122
-
123
-
124
-
125
-
126
-
127
-
128
-
129
-
130
-
131
-
132
-
133
-
134
-
135
-
136
-
137
-
138
-
139
-
140
-
141
-
142
-
143
-
144
-
145
-
146
-
147
-
148
-
149
-
150
-
151
-
152
-
153
-
154
-
155
-
156
-
157
-
158
-
159
-
160
-
161
-
162
-
163
-
164
-
165
-
166
-
167
-
168
-
169
-
170
-
171
-
172
-
173
-
174
-
175
-
176
-
177
-
178
-
179
-
180
-
181
-
182
-
183
-
 184
184 -
 185
185 -
 186
186 -
 187
187 -
 188
188 -
 189
189 -
 190
190 -
 191
191 -
 192
192 -
 193
193 -
 194
194 -
 195
195 -
 196
196 -
 197
197 -
 198
198 -
 199
199 -
 200
200 -
 201
201 -
 202
202 -
 203
203 -
 204
204 -
205
-
206
-
207
-
208
-
209
-
210
-
211
-
212
-
213
-
214
-
215
-
216
-
217
-
218
-
219
-
220
-
221
-
222
-
223
-
224
-
225
-
226
-
227
 |
 |

190
~62~
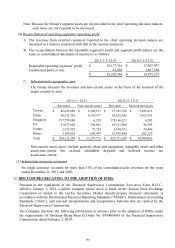
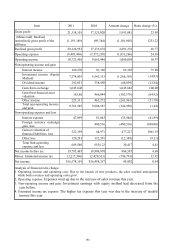
Note: Because the Group’s segment assets are not provided to the chief operating decision makers,
such items are not required to be disclosed.
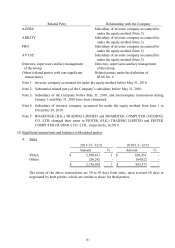
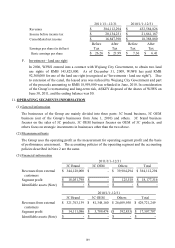
(4) Reconciliation of operating segments’ operating profit
A. The revenues from external customers reported to the chief operating decision makers are
measured in a manner consistent with that in the income statement.
B. The reconciliation between the reportable segment’s profit and segment profit (others are the
same as consolidated statements of income) is as follows:
C. Information by geographic area
The Group allocates the revenues and non-current assets on the basis of the location of the
single country or area:
Non-current assets above include property, plant and equipment, intangible assets and other
assets-non-current but exclude refundable deposits and deferred income tax
assets-non-current.
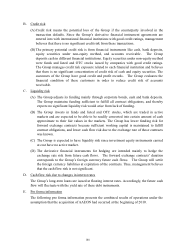
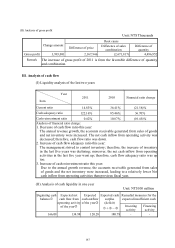
(5) Information on major customers
No single customer accounts for more than 10% of the consolidated sales revenues for the years
ended December 31, 2011 and 2010.
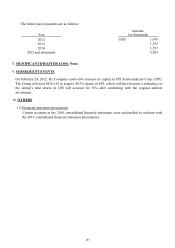
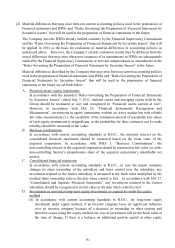
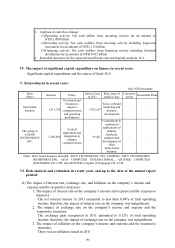
12. DISCLOSURES RELATING TO THE ADOPTION OF IFRSs
Pursuant to the regulations of the Financial Supervisory Commission, Executive Yuan, R.O.C.,
effective January 1, 2013, a public company whose stock is listed on the Taiwan Stock Exchange
Corporation or traded in the GreTai Securities Market should prepare financial statements in
accordance with the International Financial Reporting Standards (“IFRSs”), International Accounting
Standards (“IASs”), and relevant interpretations and interpretative bulletins that are ratified by the
Financial Supervisory Commission.
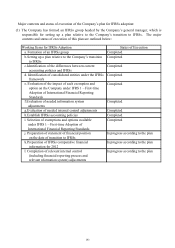
The Company discloses the following information in advance prior to the adoption of IFRSs under
the requirements of Jin-Guan-Zheng-Shen-Zi Order No. 0990004943 of the Financial Supervisory
Commission, dated February 2, 2010:
2011/1/1~12/31 2010/1/1~12/31
Reportable operating segments’ profit
18,177,316$ 17,507,707$
Unallocated profit or loss 43,430 1,467,566
18,220,746$ 18,975,273$
Revenues Non-current assets Revenues Non-current assets
Taiwan 46,439,088$ 8,188,151$ 27,587,768$ 5,985,435$
China 80,532,759 4,353,377 82,552,108 3,763,825
Singapore 197,750,880 6,220 178,166,232 6,502
US 51,871,828 130,881 69,512,900 86,595
Europe 2,327,929 57,724 3,910,192 54,496
Others 5,189,810 643,419 67,992,049 202,229
Total 384,112,294$ 13,379,772$ 429,721,249$ 10,099,082$
2011/1/1~12/31 2010/1/1~12/31