Asus 2011 Annual Report Download - page 201
Download and view the complete annual report
Please find page 201 of the 2011 Asus annual report below. You can navigate through the pages in the report by either clicking on the pages listed below, or by using the keyword search tool below to find specific information within the annual report.-
 1
1 -
2
-
3
-
4
-
5
-
6
-
7
-
8
-
9
-
10
-
11
-
12
-
13
-
14
-
15
-
16
-
17
-
18
-
19
-
20
-
21
-
22
-
23
-
24
-
25
-
26
-
27
-
28
-
29
-
30
-
31
-
32
-
33
-
34
-
35
-
36
-
37
-
38
-
39
-
40
-
41
-
42
-
43
-
44
-
45
-
46
-
47
-
48
-
49
-
50
-
51
-
52
-
53
-
54
-
55
-
56
-
57
-
58
-
59
-
60
-
61
-
62
-
63
-
64
-
65
-
66
-
67
-
68
-
69
-
70
-
71
-
72
-
73
-
74
-
75
-
76
-
77
-
78
-
79
-
80
-
81
-
82
-
83
-
84
-
85
-
86
-
87
-
88
-
89
-
90
-
91
-
92
-
93
-
94
-
95
-
96
-
97
-
98
-
99
-
100
-
101
-
102
-
103
-
104
-
105
-
106
-
107
-
108
-
109
-
110
-
111
-
112
-
113
-
114
-
115
-
116
-
117
-
118
-
119
-
120
-
121
-
122
-
123
-
124
-
125
-
126
-
127
-
128
-
129
-
130
-
131
-
132
-
133
-
134
-
135
-
136
-
137
-
138
-
139
-
140
-
141
-
142
-
143
-
144
-
145
-
146
-
147
-
148
-
149
-
150
-
151
-
152
-
153
-
154
-
155
-
156
-
157
-
158
-
159
-
160
-
161
-
162
-
163
-
164
-
165
-
166
-
167
-
168
-
169
-
170
-
171
-
172
-
173
-
174
-
175
-
176
-
177
-
178
-
179
-
180
-
181
-
182
-
183
-
184
-
185
-
186
-
187
-
188
-
189
-
190
-
 191
191 -
 192
192 -
 193
193 -
 194
194 -
 195
195 -
 196
196 -
 197
197 -
 198
198 -
 199
199 -
 200
200 -
 201
201 -
 202
202 -
 203
203 -
 204
204 -
 205
205 -
 206
206 -
 207
207 -
 208
208 -
 209
209 -
 210
210 -
 211
211 -
212
-
213
-
214
-
215
-
216
-
217
-
218
-
219
-
220
-
221
-
222
-
223
-
224
-
225
-
226
-
227
 |
 |

197
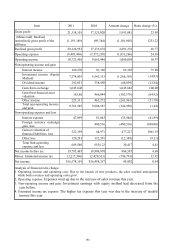
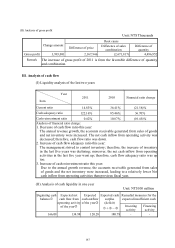
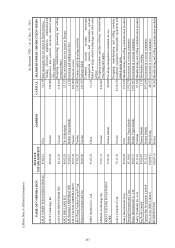
(II) Analysis of gross profit
Unit: NT$ Thousands
Change amount
Root cause
Difference of price Difference of sales
combination
Difference of
quantity
Gross profit 3,993,081 2,167,946 (2,671,817) 4,496,952
Remark The increase of gross profit of 2011 is from the favorable difference of quantity
and combination.
III. Analysis of cash flow
(I) Liquidity analysis of the last two years
Year
Item
2011 2010 Financial ratio change
Current ratio 14.83% 36.41% (21.58)%
Cash adequacy ratio 122.16% 85.46% 36.70%
Cash reinvestment ratio 0.42% 10.87% (10.45)%
Analysis of financial ratio change:
1. Decrease of cash flow ratio this year:
The annual revenue growth, the accounts receivable generated from sales of goods
and net inventory were increased. The net cash inflow from operating activity was
decreased; therefore, cash flow ratio was down.
2. Increase of cash flow adequacy ratio this year:
The management strived to control inventory; therefore, the increase of inventory
in the last five years was declining; moreover, the net cash inflow from operating
activities in the last five year went up; therefore, cash flow adequacy ratio was up
too.
3. Increase of cash reinvestment ratio this year:
Due to the annual growth revenue, the accounts receivable generated from sales
of goods and the net inventory were increased, leading to a relatively lower Net
cash inflow from operating activities than previous fiscal year.
(II) Analysis of cash liquidity in one year
Unit: NT$100 million
Beginning cash
balance
Expected net
cash flow from
operating activity
of the year
Expected
cash outflow
of the year
Expected cash
surplus
(deficit)
+-
Remedial measures for the
expected insufficient cash
Investing
activity
Financing
activity
166.08 134.98 120.28 180.78 - -