Asus 2011 Annual Report Download - page 167
Download and view the complete annual report
Please find page 167 of the 2011 Asus annual report below. You can navigate through the pages in the report by either clicking on the pages listed below, or by using the keyword search tool below to find specific information within the annual report.-
 1
1 -
2
-
3
-
4
-
5
-
6
-
7
-
8
-
9
-
10
-
11
-
12
-
13
-
14
-
15
-
16
-
17
-
18
-
19
-
20
-
21
-
22
-
23
-
24
-
25
-
26
-
27
-
28
-
29
-
30
-
31
-
32
-
33
-
34
-
35
-
36
-
37
-
38
-
39
-
40
-
41
-
42
-
43
-
44
-
45
-
46
-
47
-
48
-
49
-
50
-
51
-
52
-
53
-
54
-
55
-
56
-
57
-
58
-
59
-
60
-
61
-
62
-
63
-
64
-
65
-
66
-
67
-
68
-
69
-
70
-
71
-
72
-
73
-
74
-
75
-
76
-
77
-
78
-
79
-
80
-
81
-
82
-
83
-
84
-
85
-
86
-
87
-
88
-
89
-
90
-
91
-
92
-
93
-
94
-
95
-
96
-
97
-
98
-
99
-
100
-
101
-
102
-
103
-
104
-
105
-
106
-
107
-
108
-
109
-
110
-
111
-
112
-
113
-
114
-
115
-
116
-
117
-
118
-
119
-
120
-
121
-
122
-
123
-
124
-
125
-
126
-
127
-
128
-
129
-
130
-
131
-
132
-
133
-
134
-
135
-
136
-
137
-
138
-
139
-
140
-
141
-
142
-
143
-
144
-
145
-
146
-
147
-
148
-
149
-
150
-
151
-
152
-
153
-
154
-
155
-
156
-
 157
157 -
 158
158 -
 159
159 -
 160
160 -
 161
161 -
 162
162 -
 163
163 -
 164
164 -
 165
165 -
 166
166 -
 167
167 -
 168
168 -
 169
169 -
 170
170 -
 171
171 -
 172
172 -
 173
173 -
 174
174 -
 175
175 -
 176
176 -
 177
177 -
178
-
179
-
180
-
181
-
182
-
183
-
184
-
185
-
186
-
187
-
188
-
189
-
190
-
191
-
192
-
193
-
194
-
195
-
196
-
197
-
198
-
199
-
200
-
201
-
202
-
203
-
204
-
205
-
206
-
207
-
208
-
209
-
210
-
211
-
212
-
213
-
214
-
215
-
216
-
217
-
218
-
219
-
220
-
221
-
222
-
223
-
224
-
225
-
226
-
227
 |
 |

163
~35~
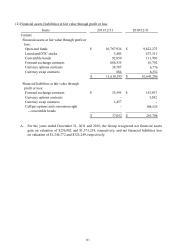
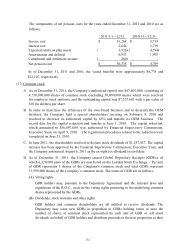
(3) Available-for-sale financial assets
A. For available-for-sale financial assets, the amount of gain recognized directly in equity was
$316,902 and $275,550 for the years ended December 31, 2011 and 2010, respectively.
B. After evaluating and comparing the carrying value of available-for-sale financial assets and the
recoverable amount, the Group recognized impairment loss amounting to $37,636 and $64,616
for the years ended December 31, 2011 and 2010, respectively.
(4) Financial assets carried at cost
A. The above investments were measured at cost since there are no public quotes in active
markets and their fair value cannot be measured reliably.
B. The Group lost significant influence on AZURE on June 1, 2010, the spin-off date, and
accordingly discontinued applying the equity method.
C. After evaluating and comparing the carrying value of financial assets carried at cost and the
recoverable amount, the Group recognized impairment loss amounting to $117,000 and
$89,536 for the years ended December 31, 2011 and 2010, respectively.
Items
2011/12/31
2010/12/31
Current:
Listed and OTC stocks
AZURE 250,672$ -$
EDISON - 100,625
Others
83,251
36,168
333,923$ 136,793$
Non-current:
Listed and OTC stocks
ADVANTECH
7,015,732
$
6,278,997
$
Others
71,951
87,351
7,087,683$ 6,366,348$
Items 2011/12/31 2010/12/31
Current:
Unlisted and non-OTC stocks
Others 3 7 2$ 3 7 2$
Non-current:
Unlisted and non-OTC stocks
AZURE -$ 295,608$
MSTAR 122,696 122,696
UPI 82,000 150,000
Others 410,529 392,716
Mutual fund-private fund
37,947
129,015
653,172$ 1,090,035$