Asus 2011 Annual Report Download - page 182
Download and view the complete annual report
Please find page 182 of the 2011 Asus annual report below. You can navigate through the pages in the report by either clicking on the pages listed below, or by using the keyword search tool below to find specific information within the annual report.-
 1
1 -
2
-
3
-
4
-
5
-
6
-
7
-
8
-
9
-
10
-
11
-
12
-
13
-
14
-
15
-
16
-
17
-
18
-
19
-
20
-
21
-
22
-
23
-
24
-
25
-
26
-
27
-
28
-
29
-
30
-
31
-
32
-
33
-
34
-
35
-
36
-
37
-
38
-
39
-
40
-
41
-
42
-
43
-
44
-
45
-
46
-
47
-
48
-
49
-
50
-
51
-
52
-
53
-
54
-
55
-
56
-
57
-
58
-
59
-
60
-
61
-
62
-
63
-
64
-
65
-
66
-
67
-
68
-
69
-
70
-
71
-
72
-
73
-
74
-
75
-
76
-
77
-
78
-
79
-
80
-
81
-
82
-
83
-
84
-
85
-
86
-
87
-
88
-
89
-
90
-
91
-
92
-
93
-
94
-
95
-
96
-
97
-
98
-
99
-
100
-
101
-
102
-
103
-
104
-
105
-
106
-
107
-
108
-
109
-
110
-
111
-
112
-
113
-
114
-
115
-
116
-
117
-
118
-
119
-
120
-
121
-
122
-
123
-
124
-
125
-
126
-
127
-
128
-
129
-
130
-
131
-
132
-
133
-
134
-
135
-
136
-
137
-
138
-
139
-
140
-
141
-
142
-
143
-
144
-
145
-
146
-
147
-
148
-
149
-
150
-
151
-
152
-
153
-
154
-
155
-
156
-
157
-
158
-
159
-
160
-
161
-
162
-
163
-
164
-
165
-
166
-
167
-
168
-
169
-
170
-
171
-
 172
172 -
 173
173 -
 174
174 -
 175
175 -
 176
176 -
 177
177 -
 178
178 -
 179
179 -
 180
180 -
 181
181 -
 182
182 -
 183
183 -
 184
184 -
 185
185 -
 186
186 -
 187
187 -
 188
188 -
 189
189 -
 190
190 -
 191
191 -
 192
192 -
193
-
194
-
195
-
196
-
197
-
198
-
199
-
200
-
201
-
202
-
203
-
204
-
205
-
206
-
207
-
208
-
209
-
210
-
211
-
212
-
213
-
214
-
215
-
216
-
217
-
218
-
219
-
220
-
221
-
222
-
223
-
224
-
225
-
226
-
227
 |
 |

178
~50~
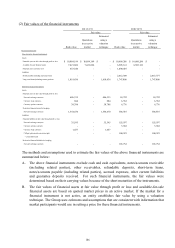
(22) Earnings per share
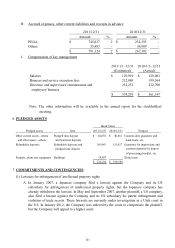
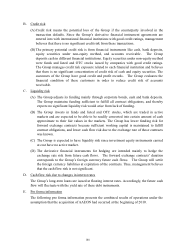
(23) Personnel, depreciation, and amortization expenses
Personnel, depreciation, and amortization expenses are summarized as follows:
Weighted
average
outstanding
common shares
Before tax After tax (in thousands) Before tax After tax
Basic earnings per share:
Net income 19,795,465$ 16,578,159$ 753,776 26.26$ 21.99$
Dilutive effect of common
stock equivalents:
Convertible bonds 57,434)( 57,434)( 7,994
Employees' bonus --4,694
Net income attributable to
common stockholders plus
dilutive effect of common
stock equivalents
19,738,031$ 16,520,725$ 766,464$ 25.75$ 21.55$
2011/1/1~12/31
Amount Earnings per share (in dollars)
Weighted
average
outstanding
common shares
Before tax After tax (in thousands) Before tax After tax
Basic earnings per share:
Net income 18,908,870$ 16,488,357$ 2,607,155 7.25$ 6 . 3 2$
Dilutive effect of common
stock equivalents:
Convertible bonds 69,835)( 69,921)( 36,355
Employees' bonus --7,453
Net income attributable to
common stockholders plus
dilutive effect of common
stock equivalents
18,839,035$ 16,418,436$ 2,650,963 7.11$ 6 . 1 9$
2010/1/1~12/31
Amount Earnings per share (in dollars)
Operating Operating Operating Operating
Item costs expenses Total costs expenses Total
Personnel expenses
Salaries 2,619,053$ 11,761,031$ 14,380,084$ 6,982,414$ 11,195,325$ 18,177,739$
Labor and health insurances 157,346 605,100 762,446 494,739 623,883 1,118,622
Pension 152,340 367,569 519,909 313,665 399,798 713,463
Others 39,176 234,794 273,970 335,984 321,421 657,405
Depreciation 1,242,120 625,361 1,867,481 3,339,664 1,107,781 4,447,445
Amortization 30,436 259,430 289,866 528,392 621,636 1,150,028
2011/1/1~12/31 2010/1/1~12/31