Asus 2011 Annual Report Download - page 190
Download and view the complete annual report
Please find page 190 of the 2011 Asus annual report below. You can navigate through the pages in the report by either clicking on the pages listed below, or by using the keyword search tool below to find specific information within the annual report.-
 1
1 -
2
-
3
-
4
-
5
-
6
-
7
-
8
-
9
-
10
-
11
-
12
-
13
-
14
-
15
-
16
-
17
-
18
-
19
-
20
-
21
-
22
-
23
-
24
-
25
-
26
-
27
-
28
-
29
-
30
-
31
-
32
-
33
-
34
-
35
-
36
-
37
-
38
-
39
-
40
-
41
-
42
-
43
-
44
-
45
-
46
-
47
-
48
-
49
-
50
-
51
-
52
-
53
-
54
-
55
-
56
-
57
-
58
-
59
-
60
-
61
-
62
-
63
-
64
-
65
-
66
-
67
-
68
-
69
-
70
-
71
-
72
-
73
-
74
-
75
-
76
-
77
-
78
-
79
-
80
-
81
-
82
-
83
-
84
-
85
-
86
-
87
-
88
-
89
-
90
-
91
-
92
-
93
-
94
-
95
-
96
-
97
-
98
-
99
-
100
-
101
-
102
-
103
-
104
-
105
-
106
-
107
-
108
-
109
-
110
-
111
-
112
-
113
-
114
-
115
-
116
-
117
-
118
-
119
-
120
-
121
-
122
-
123
-
124
-
125
-
126
-
127
-
128
-
129
-
130
-
131
-
132
-
133
-
134
-
135
-
136
-
137
-
138
-
139
-
140
-
141
-
142
-
143
-
144
-
145
-
146
-
147
-
148
-
149
-
150
-
151
-
152
-
153
-
154
-
155
-
156
-
157
-
158
-
159
-
160
-
161
-
162
-
163
-
164
-
165
-
166
-
167
-
168
-
169
-
170
-
171
-
172
-
173
-
174
-
175
-
176
-
177
-
178
-
179
-
 180
180 -
 181
181 -
 182
182 -
 183
183 -
 184
184 -
 185
185 -
 186
186 -
 187
187 -
 188
188 -
 189
189 -
 190
190 -
 191
191 -
 192
192 -
 193
193 -
 194
194 -
 195
195 -
 196
196 -
 197
197 -
 198
198 -
 199
199 -
 200
200 -
201
-
202
-
203
-
204
-
205
-
206
-
207
-
208
-
209
-
210
-
211
-
212
-
213
-
214
-
215
-
216
-
217
-
218
-
219
-
220
-
221
-
222
-
223
-
224
-
225
-
226
-
227
 |
 |

186
~58~
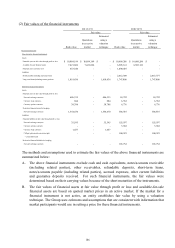
(2) Fair values of the financial instruments
The methods and assumptions used to estimate the fair values of the above financial instruments are
summarized below:
A. The above financial instruments exclude cash and cash equivalents, notes/accounts receivable
(including related parties), other receivables, refundable deposits, short-term loans,
notes/accounts payable (including related parties), accrued expenses, other current liabilities
and guarantee deposits received. For such financial instruments, the fair values were
determined based on their carrying values because of the short maturities of the instruments.
B. The fair values of financial assets at fair value through profit or loss and available-for-sale
financial assets are based on quoted market prices in an active market. If the market for a
financial instrument is not active, an entity establishes fair value by using a valuation
technique. The Group uses estimates and assumptions that are consistent with information that
market participants would use in setting a price for these financial instruments.
Estimated Estimated
Quotations using a Quotations using a
in an active valuation in an active valuation
Book value market technique Book value market technique
Financial instruments
Non-derivative financial instruments
Assets
Financial assets at fair value through profit or loss 10,884,189$ 10,884,189$ -$ 10,609,286$ 10,609,286$ -$
Available-for-sale financial assets 7,421,606 7,421,606 - 6,503,141 6,503,141 -
Financial assets carried at cost 653,544 - - 1,090,407 - -
Liabilities
Bonds payable (including current portion) - - - 2,412,309 - 2,415,377
Long-term loans (including current portion) 1,818,436 - 1,818,436 1,747,800 - 1,747,800
Derivative financial instruments
Assets
Financial assets at fair value through profit or loss
Forward exchange contracts 686,335 - 686,335 18,792 - 18,792
Currency swap contracts 884 - 884 6,352 - 6,352
Currency options contracts 38,788 - 38,788 6,776 - 6,776
Derivative financial assets for hedging
Forward exchange contracts 1,354,470 - 1,354,470 386,387 - 386,387
Liabilities
Financial liabilities at fair value through profit or loss
Forward exchange contracts 35,595 - 35,595 155,597 - 155,597
Currency options contracts - - - 3,582 - 3,582
Currency swap contracts 1,457 - 1,457 - - -
Call/put options and conversion right - - - 104,525 - 104,525
- convertible bonds
Derivative financial liabilities for hedging
Forward exchange contracts - - - 185,732 - 185,732
2011/12/31 2010/12/31
Fair value Fair value