Asus 2011 Annual Report Download - page 112
Download and view the complete annual report
Please find page 112 of the 2011 Asus annual report below. You can navigate through the pages in the report by either clicking on the pages listed below, or by using the keyword search tool below to find specific information within the annual report.-
 1
1 -
2
-
3
-
4
-
5
-
6
-
7
-
8
-
9
-
10
-
11
-
12
-
13
-
14
-
15
-
16
-
17
-
18
-
19
-
20
-
21
-
22
-
23
-
24
-
25
-
26
-
27
-
28
-
29
-
30
-
31
-
32
-
33
-
34
-
35
-
36
-
37
-
38
-
39
-
40
-
41
-
42
-
43
-
44
-
45
-
46
-
47
-
48
-
49
-
50
-
51
-
52
-
53
-
54
-
55
-
56
-
57
-
58
-
59
-
60
-
61
-
62
-
63
-
64
-
65
-
66
-
67
-
68
-
69
-
70
-
71
-
72
-
73
-
74
-
75
-
76
-
77
-
78
-
79
-
80
-
81
-
82
-
83
-
84
-
85
-
86
-
87
-
88
-
89
-
90
-
91
-
92
-
93
-
94
-
95
-
96
-
97
-
98
-
99
-
100
-
101
-
 102
102 -
 103
103 -
 104
104 -
 105
105 -
 106
106 -
 107
107 -
 108
108 -
 109
109 -
 110
110 -
 111
111 -
 112
112 -
 113
113 -
 114
114 -
 115
115 -
 116
116 -
 117
117 -
 118
118 -
 119
119 -
 120
120 -
 121
121 -
 122
122 -
123
-
124
-
125
-
126
-
127
-
128
-
129
-
130
-
131
-
132
-
133
-
134
-
135
-
136
-
137
-
138
-
139
-
140
-
141
-
142
-
143
-
144
-
145
-
146
-
147
-
148
-
149
-
150
-
151
-
152
-
153
-
154
-
155
-
156
-
157
-
158
-
159
-
160
-
161
-
162
-
163
-
164
-
165
-
166
-
167
-
168
-
169
-
170
-
171
-
172
-
173
-
174
-
175
-
176
-
177
-
178
-
179
-
180
-
181
-
182
-
183
-
184
-
185
-
186
-
187
-
188
-
189
-
190
-
191
-
192
-
193
-
194
-
195
-
196
-
197
-
198
-
199
-
200
-
201
-
202
-
203
-
204
-
205
-
206
-
207
-
208
-
209
-
210
-
211
-
212
-
213
-
214
-
215
-
216
-
217
-
218
-
219
-
220
-
221
-
222
-
223
-
224
-
225
-
226
-
227
 |
 |

108
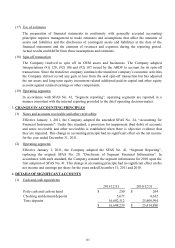
(5) Accounts receivable
(6) Inventories
Except for cost of goods sold, the inventories recognized as decrease in operating costs amounted
to $712,105 and $492,549, of which $714,747 and $496,780 were net realizable value recovery
of inventories because some inventories with allowance for decline in value had been sold during
the years ended December 31, 2011 and 2010, respectively.
(7) Long-term equity investments
A. Details of long-term equity investments accounted for under the equity method are as follows:
2011/12/31 2010/12/31
Accounts receivable 2,700,985$ 9,191,918$
Less: allowance for doubtful accounts 31,227)( 108,004)(
(provision for impairment)
2,669,758$ 9,083,914$
2011/12/31 2010/12/31
Raw materials 5,378,508$ 5,602,157$
Work in process 1,169,467 826,566
Finished goods 636,649 712,639
Merchandise inventories 13,957,561 10,249,608
Inventories in transit 183,848 80,601
21,326,033 17,471,571
Less: allowance for decline in value of inventories 1,176,527)( 1,891,274)(
20,149,506$ 15,580,297$
Percentage Percentage
Carrying of Carrying of
Investee company amount ownership amount ownership
PEGA 22,374,681$ 24.46 22,165,896$ 24.45
AIL 19,415,417 100.00 10,839,491 100.00
ASKEY 9,584,598 100.00 8,845,738 100.00
AAEON 2,607,452 47.00 4,527 47.00
HCVC 1,069,666 100.00 1,208,539 100.00
HMI 717,382 100.00 695,349 100.00
AHL 670,831 100.00 867,926 100.00
ASUTC 484,986 100.00 496,762 100.00
Others 1,459,545 1,099,493
58,384,558$ 46,223,721$
2011/12/31
2010/12/31