APS 2015 Annual Report Download - page 96
Download and view the complete annual report
Please find page 96 of the 2015 APS annual report below. You can navigate through the pages in the report by either clicking on the pages listed below, or by using the keyword search tool below to find specific information within the annual report.-
 1
1 -
2
-
3
-
4
-
5
-
6
-
7
-
8
-
9
-
10
-
11
-
12
-
13
-
14
-
15
-
16
-
17
-
18
-
19
-
20
-
21
-
22
-
23
-
24
-
25
-
26
-
27
-
28
-
29
-
30
-
31
-
32
-
33
-
34
-
35
-
36
-
37
-
38
-
39
-
40
-
41
-
42
-
43
-
44
-
45
-
46
-
47
-
48
-
49
-
50
-
51
-
52
-
53
-
54
-
55
-
56
-
57
-
58
-
59
-
60
-
61
-
62
-
63
-
64
-
65
-
66
-
67
-
68
-
69
-
70
-
71
-
72
-
73
-
74
-
75
-
76
-
77
-
78
-
79
-
80
-
81
-
82
-
83
-
84
-
85
-
 86
86 -
 87
87 -
 88
88 -
 89
89 -
 90
90 -
 91
91 -
 92
92 -
 93
93 -
 94
94 -
 95
95 -
 96
96 -
 97
97 -
 98
98 -
 99
99 -
 100
100 -
 101
101 -
 102
102 -
 103
103 -
 104
104 -
 105
105 -
 106
106 -
107
-
108
-
109
-
110
-
111
-
112
-
113
-
114
-
115
-
116
-
117
-
118
-
119
-
120
-
121
-
122
-
123
-
124
-
125
-
126
-
127
-
128
-
129
-
130
-
131
-
132
-
133
-
134
-
135
-
136
-
137
-
138
-
139
-
140
-
141
-
142
-
143
-
144
-
145
-
146
-
147
-
148
-
149
-
150
-
151
-
152
-
153
-
154
-
155
-
156
-
157
-
158
-
159
-
160
-
161
-
162
-
163
-
164
-
165
-
166
-
167
-
168
-
169
-
170
-
171
-
172
-
173
-
174
-
175
-
176
-
177
-
178
-
179
-
180
-
181
-
182
-
183
-
184
-
185
-
186
-
187
-
188
-
189
-
190
-
191
-
192
-
193
-
194
-
195
-
196
-
197
-
198
-
199
-
200
-
201
-
202
-
203
-
204
-
205
-
206
-
207
-
208
-
209
-
210
-
211
-
212
-
213
-
214
-
215
-
216
-
217
-
218
-
219
-
220
-
221
-
222
-
223
-
224
-
225
-
226
-
227
-
228
-
229
-
230
-
231
-
232
-
233
-
234
-
235
-
236
-
237
-
238
-
239
-
240
-
241
-
242
-
243
-
244
-
245
-
246
-
247
-
248
-
249
-
250
-
251
-
252
-
253
-
254
-
255
-
256
-
257
-
258
-
259
-
260
-
261
-
262
-
263
-
264
 |
 |

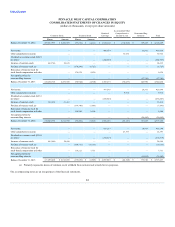
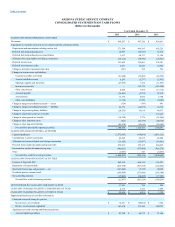
Table of Contents
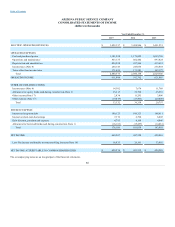
ARIZONA PUBLIC SERVICE COMPANY
CONSOLIDATED STATEMENTS OF CHANGES IN EQUITY
(dollars in thousands)
Common Stock
Additional
Paid-In Capital
Retained
Earnings
Accumulated Other
Comprehensive
Income (Loss)
Noncontrolling
Interests
Total
Shares
Amount
Balance, December 31, 2012 71,264,947
$ 178,162
$ 2,379,696
$ 1,624,237
$ (89,095)
$ 129,483
$ 4,222,483
Net income
—
—
424,969
—
33,892
458,861
Other comprehensive income
—
—
—
35,723
—
35,723
Dividends on common stock
—
—
(244,800)
—
—
(244,800)
Other
—
—
(8)
—
—
(8)
Net capital activities by noncontrolling
interests
—
—
—
—
(17,385)
(17,385)
Balance, December 31, 2013 71,264,947
178,162
2,379,696
1,804,398
(53,372)
145,990
4,454,874
Net income
—
—
421,219
—
26,101
447,320
Other comprehensive income
—
—
—
5,039
—
5,039
Dividends on common stock
—
—
(256,900)
—
—
(256,900)
Other
—
—
1
—
—
1
Net capital activities by noncontrolling
interests
—
—
—
—
(20,482)
(20,482)
Balance, December 31, 2014 71,264,947
178,162
2,379,696
1,968,718
(48,333)
151,609
4,629,852
Net income
—
—
450,274
—
18,933
469,207
Other comprehensive income
—
—
—
21,236
—
21,236
Dividends on common stock
—
—
(270,500)
—
—
(270,500)
Other
—
—
1
—
—
1
Net capital activities by noncontrolling
interests
—
—
—
—
(35,002)
(35,002)
Balance, December 31, 2015 71,264,947
$ 178,162
$ 2,379,696
$ 2,148,493
$ (27,097)
$ 135,540
$ 4,814,794
The accompanying notes are an integral part of the financial statements.
91