APS 2015 Annual Report Download - page 86
Download and view the complete annual report
Please find page 86 of the 2015 APS annual report below. You can navigate through the pages in the report by either clicking on the pages listed below, or by using the keyword search tool below to find specific information within the annual report.-
 1
1 -
2
-
3
-
4
-
5
-
6
-
7
-
8
-
9
-
10
-
11
-
12
-
13
-
14
-
15
-
16
-
17
-
18
-
19
-
20
-
21
-
22
-
23
-
24
-
25
-
26
-
27
-
28
-
29
-
30
-
31
-
32
-
33
-
34
-
35
-
36
-
37
-
38
-
39
-
40
-
41
-
42
-
43
-
44
-
45
-
46
-
47
-
48
-
49
-
50
-
51
-
52
-
53
-
54
-
55
-
56
-
57
-
58
-
59
-
60
-
61
-
62
-
63
-
64
-
65
-
66
-
67
-
68
-
69
-
70
-
71
-
72
-
73
-
74
-
75
-
 76
76 -
 77
77 -
 78
78 -
 79
79 -
 80
80 -
 81
81 -
 82
82 -
 83
83 -
 84
84 -
 85
85 -
 86
86 -
 87
87 -
 88
88 -
 89
89 -
 90
90 -
 91
91 -
 92
92 -
 93
93 -
 94
94 -
 95
95 -
 96
96 -
97
-
98
-
99
-
100
-
101
-
102
-
103
-
104
-
105
-
106
-
107
-
108
-
109
-
110
-
111
-
112
-
113
-
114
-
115
-
116
-
117
-
118
-
119
-
120
-
121
-
122
-
123
-
124
-
125
-
126
-
127
-
128
-
129
-
130
-
131
-
132
-
133
-
134
-
135
-
136
-
137
-
138
-
139
-
140
-
141
-
142
-
143
-
144
-
145
-
146
-
147
-
148
-
149
-
150
-
151
-
152
-
153
-
154
-
155
-
156
-
157
-
158
-
159
-
160
-
161
-
162
-
163
-
164
-
165
-
166
-
167
-
168
-
169
-
170
-
171
-
172
-
173
-
174
-
175
-
176
-
177
-
178
-
179
-
180
-
181
-
182
-
183
-
184
-
185
-
186
-
187
-
188
-
189
-
190
-
191
-
192
-
193
-
194
-
195
-
196
-
197
-
198
-
199
-
200
-
201
-
202
-
203
-
204
-
205
-
206
-
207
-
208
-
209
-
210
-
211
-
212
-
213
-
214
-
215
-
216
-
217
-
218
-
219
-
220
-
221
-
222
-
223
-
224
-
225
-
226
-
227
-
228
-
229
-
230
-
231
-
232
-
233
-
234
-
235
-
236
-
237
-
238
-
239
-
240
-
241
-
242
-
243
-
244
-
245
-
246
-
247
-
248
-
249
-
250
-
251
-
252
-
253
-
254
-
255
-
256
-
257
-
258
-
259
-
260
-
261
-
262
-
263
-
264
 |
 |
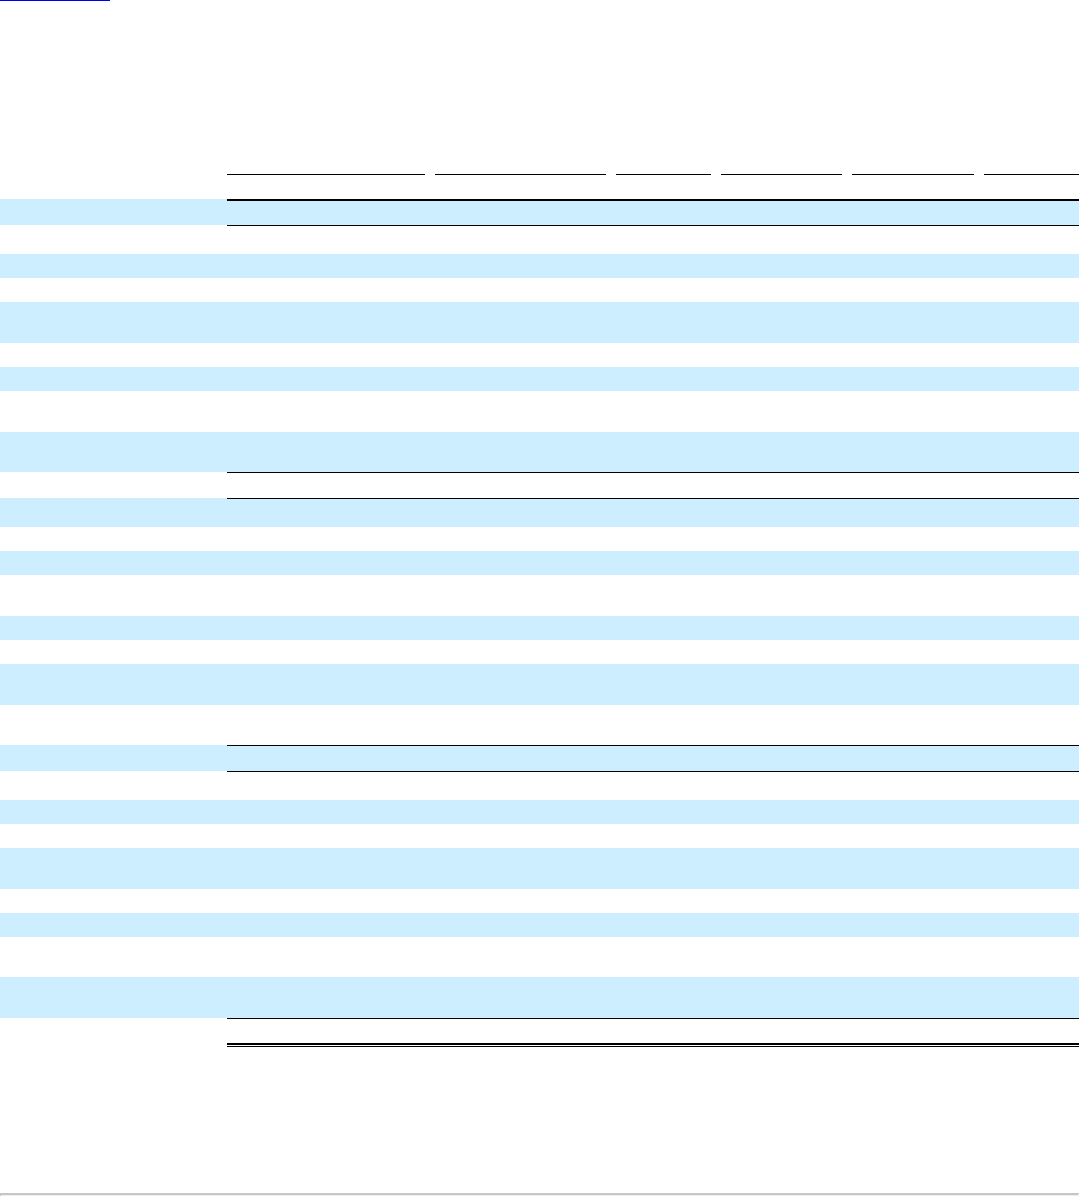
Table of Contents
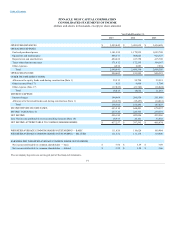
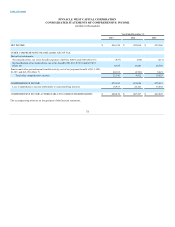
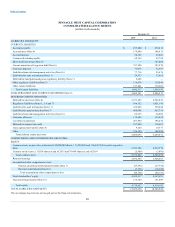
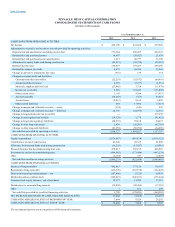
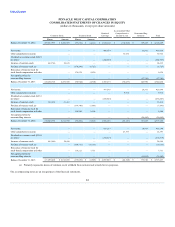
PINNACLE WEST CAPITAL CORPORATION
CONSOLIDATED STATEMENTS OF CHANGES IN EQUITY
(dollars in thousands, except per share amounts)
Common Stock
Treasury Stock
Retained
Earnings
Accumulated Other
Comprehensive
Income (Loss)
Noncontrolling
Interests
Total
Shares
Amount
Shares
Amount
Balance, December 31, 2012 109,837,957
$ 2,466,923
(95,192)
$ (4,211)
$ 1,624,102
$ (114,008)
$ 129,483
$ 4,102,289
Net income
—
—
406,074
—
33,892
439,966
Other comprehensive income
—
—
—
35,955
—
35,955
Dividends on common stock ($2.23
per share)
—
—
(244,903)
—
—
(244,903)
Issuance of common stock 442,746
24,635
—
—
—
—
24,635
Purchase of treasury stock (a)
—
(174,290)
(9,727)
—
—
—
(9,727)
Reissuance of treasury stock for
stock-based compensation and other
—
170,538
9,630
—
—
—
9,630
Net capital activities by
noncontrolling interests
—
—
—
—
(17,385)
(17,385)
Balance, December 31, 2013 110,280,703
2,491,558
(98,944)
(4,308)
1,785,273
(78,053)
145,990
4,340,460
Net income
—
—
397,595
—
26,101
423,696
Other comprehensive income
—
—
—
9,912
—
9,912
Dividends on common stock ($2.33
per share)
—
—
(256,803)
—
—
(256,803)
Issuance of common stock 369,059
21,412
—
—
—
—
21,412
Purchase of treasury stock (a)
—
(139,746)
(7,893)
—
—
—
(7,893)
Reissuance of treasury stock for
stock-based compensation and other
—
160,290
8,800
—
—
—
8,800
Net capital activities by
noncontrolling interests
—
—
—
—
(20,482)
(20,482)
Balance, December 31, 2014 110,649,762
2,512,970
(78,400) (3,401)
1,926,065
(68,141)
151,609
4,519,102
Net income
—
—
437,257
—
18,933
456,190
Other comprehensive income
—
—
—
23,393
—
23,393
Dividends on common stock ($2.44
per share)
—
—
(270,519)
—
—
(270,519)
Issuance of common stock 445,640
28,698
—
—
—
—
28,698
Purchase of treasury stock (a)
—
(154,751)
(10,136)
—
—
—
(10,136)
Reissuance of treasury stock for
stock-based compensation and other
—
118,121
7,731
—
—
—
7,731
Net capital activities by
noncontrolling interests
—
—
—
—
(35,002)
(35,002)
Balance, December 31, 2015 111,095,402
$ 2,541,668
(115,030)
$ (5,806)
$ 2,092,803
$ (44,748)
$ 135,540
$ 4,719,457
(a) Primarily represents shares of common stock withheld from certain stock awards for tax purposes.
The accompanying notes are an integral part of the financial statements.
82