APS 2015 Annual Report Download - page 49
Download and view the complete annual report
Please find page 49 of the 2015 APS annual report below. You can navigate through the pages in the report by either clicking on the pages listed below, or by using the keyword search tool below to find specific information within the annual report.-
 1
1 -
 2
2 -
 3
3 -
 4
4 -
 5
5 -
 6
6 -
 7
7 -
 8
8 -
 9
9 -
 10
10 -
 11
11 -
 12
12 -
 13
13 -
 14
14 -
 15
15 -
 16
16 -
 17
17 -
 18
18 -
 19
19 -
 20
20 -
 21
21 -
 22
22 -
 23
23 -
 24
24 -
 25
25 -
 26
26 -
 27
27 -
 28
28 -
 29
29 -
 30
30 -
 31
31 -
 32
32 -
 33
33 -
 34
34 -
 35
35 -
 36
36 -
 37
37 -
 38
38 -
 39
39 -
 40
40 -
 41
41 -
 42
42 -
 43
43 -
 44
44 -
 45
45 -
 46
46 -
 47
47 -
 48
48 -
 49
49 -
 50
50 -
 51
51 -
 52
52 -
 53
53 -
 54
54 -
 55
55 -
 56
56 -
 57
57 -
 58
58 -
 59
59 -
 60
60 -
 61
61 -
 62
62 -
 63
63 -
 64
64 -
 65
65 -
 66
66 -
 67
67 -
 68
68 -
 69
69 -
 70
70 -
 71
71 -
 72
72 -
 73
73 -
 74
74 -
 75
75 -
 76
76 -
 77
77 -
 78
78 -
 79
79 -
 80
80 -
 81
81 -
 82
82 -
 83
83 -
 84
84 -
 85
85 -
 86
86 -
 87
87 -
 88
88 -
 89
89 -
 90
90 -
 91
91 -
 92
92 -
 93
93 -
 94
94 -
 95
95 -
 96
96 -
 97
97 -
 98
98 -
 99
99 -
 100
100 -
 101
101 -
 102
102 -
 103
103 -
 104
104 -
 105
105 -
 106
106 -
 107
107 -
 108
108 -
 109
109 -
 110
110 -
 111
111 -
 112
112 -
 113
113 -
 114
114 -
 115
115 -
 116
116 -
 117
117 -
 118
118 -
 119
119 -
 120
120 -
 121
121 -
 122
122 -
 123
123 -
 124
124 -
 125
125 -
 126
126 -
 127
127 -
 128
128 -
 129
129 -
 130
130 -
 131
131 -
 132
132 -
 133
133 -
 134
134 -
 135
135 -
 136
136 -
 137
137 -
 138
138 -
 139
139 -
 140
140 -
 141
141 -
 142
142 -
 143
143 -
 144
144 -
 145
145 -
 146
146 -
 147
147 -
 148
148 -
 149
149 -
 150
150 -
 151
151 -
 152
152 -
 153
153 -
 154
154 -
 155
155 -
 156
156 -
 157
157 -
 158
158 -
 159
159 -
 160
160 -
 161
161 -
 162
162 -
 163
163 -
 164
164 -
 165
165 -
 166
166 -
 167
167 -
 168
168 -
 169
169 -
 170
170 -
 171
171 -
 172
172 -
 173
173 -
 174
174 -
 175
175 -
 176
176 -
 177
177 -
 178
178 -
 179
179 -
 180
180 -
 181
181 -
 182
182 -
 183
183 -
 184
184 -
 185
185 -
 186
186 -
 187
187 -
 188
188 -
 189
189 -
 190
190 -
 191
191 -
 192
192 -
 193
193 -
 194
194 -
 195
195 -
 196
196 -
 197
197 -
 198
198 -
 199
199 -
 200
200 -
 201
201 -
 202
202 -
 203
203 -
 204
204 -
 205
205 -
 206
206 -
 207
207 -
 208
208 -
 209
209 -
 210
210 -
 211
211 -
 212
212 -
 213
213 -
 214
214 -
 215
215 -
 216
216 -
 217
217 -
 218
218 -
 219
219 -
 220
220 -
 221
221 -
 222
222 -
 223
223 -
 224
224 -
 225
225 -
 226
226 -
 227
227 -
 228
228 -
 229
229 -
 230
230 -
 231
231 -
 232
232 -
 233
233 -
 234
234 -
 235
235 -
 236
236 -
 237
237 -
 238
238 -
 239
239 -
 240
240 -
 241
241 -
 242
242 -
 243
243 -
 244
244 -
 245
245 -
 246
246 -
 247
247 -
 248
248 -
 249
249 -
 250
250 -
 251
251 -
 252
252 -
 253
253 -
 254
254 -
 255
255 -
 256
256 -
 257
257 -
 258
258 -
 259
259 -
 260
260 -
 261
261 -
 262
262 -
 263
263 -
 264
264
 |
 |

Table of Contents
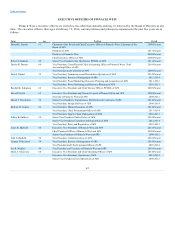
ITEM 6. SELECTED FINANCIAL DATA
PINNACLE WEST CAPITAL CORPORATION – CONSOLIDATED
The selected data presented below as of and for the years ended December 31, 2015, 2014, 2013, 2012 and 2011 are derived
from the Consolidated Financial Statements. The data should be read in connection with the Consolidated Financial Statements
including the related notes included in Item 8 of this Form 10-K.
2015
2014
2013
2012
2011
(dollars in thousands, except per share amounts)
OPERATING RESULTS
Operating revenues
$ 3,495,443
$ 3,491,632
$ 3,454,628
$ 3,301,804
$ 3,241,379
Income from continuing operations
$ 456,190
$ 423,696
$ 439,966
$ 418,993
$ 355,634
Income (loss) from discontinued operations –
net of income taxes
—
—
—
(5,829)
11,306
Net income
456,190
423,696
439,966
413,164
366,940
Less: Net income attributable to
noncontrolling interests
18,933
26,101
33,892
31,622
27,467
Net income attributable to common
shareholders
$ 437,257
$ 397,595
$ 406,074
$ 381,542
$ 339,473
COMMON STOCK DATA
Book value per share – year-end
$ 41.30
$ 39.50
$ 38.07
$ 36.20
$ 34.98
Earnings per weighted-average common share
outstanding:
Continuing operations attributable to
common shareholders – basic
$ 3.94
$ 3.59
$ 3.69
$ 3.54
$ 3.01
Net income attributable to common
shareholders – basic
$ 3.94
$ 3.59
$ 3.69
$ 3.48
$ 3.11
Continuing operations attributable to
common shareholders – diluted
$ 3.92
$ 3.58
$ 3.66
$ 3.50
$ 2.99
Net income attributable to common
shareholders – diluted
$ 3.92
$ 3.58
$ 3.66
$ 3.45
$ 3.09
Dividends declared per share
$ 2.44
$ 2.33
$ 2.23
$ 2.67
$ 2.10
Weighted-average common shares
outstanding – basic
111,025,944
110,626,101
109,984,160
109,510,296
109,052,840
Weighted-average common shares
outstanding – diluted
111,552,130
111,178,141
110,805,943
110,527,311
109,864,243
BALANCE SHEET DATA (a)
Total assets
$ 15,028,258
$ 14,288,890
$ 13,486,826
$ 13,357,123
$ 13,089,837
Liabilities and equity:
Current liabilities
$ 1,442,317
$ 1,559,143
$ 1,618,644
$ 1,083,542
$ 1,342,705
Long-term debt less current maturities
3,462,391
3,006,573
2,774,605
3,176,596
2,997,873
Deferred credits and other
5,404,093
5,204,072
4,753,117
4,994,696
4,818,673
Total liabilities
10,308,801
9,769,788
9,146,366
9,254,834
9,159,251
Total equity
4,719,457
4,519,102
4,340,460
4,102,289
3,930,586
Total liabilities and equity
$ 15,028,258
$ 14,288,890
$ 13,486,826
$ 13,357,123
$ 13,089,837
(a) During the fourth quarter of 2015, we adopted the new accounting standard related to balance sheet presentation of debt issuance
costs. See further discussion in Note 2.
46
