APS 2015 Annual Report Download - page 155
Download and view the complete annual report
Please find page 155 of the 2015 APS annual report below. You can navigate through the pages in the report by either clicking on the pages listed below, or by using the keyword search tool below to find specific information within the annual report.-
 1
1 -
2
-
3
-
4
-
5
-
6
-
7
-
8
-
9
-
10
-
11
-
12
-
13
-
14
-
15
-
16
-
17
-
18
-
19
-
20
-
21
-
22
-
23
-
24
-
25
-
26
-
27
-
28
-
29
-
30
-
31
-
32
-
33
-
34
-
35
-
36
-
37
-
38
-
39
-
40
-
41
-
42
-
43
-
44
-
45
-
46
-
47
-
48
-
49
-
50
-
51
-
52
-
53
-
54
-
55
-
56
-
57
-
58
-
59
-
60
-
61
-
62
-
63
-
64
-
65
-
66
-
67
-
68
-
69
-
70
-
71
-
72
-
73
-
74
-
75
-
76
-
77
-
78
-
79
-
80
-
81
-
82
-
83
-
84
-
85
-
86
-
87
-
88
-
89
-
90
-
91
-
92
-
93
-
94
-
95
-
96
-
97
-
98
-
99
-
100
-
101
-
102
-
103
-
104
-
105
-
106
-
107
-
108
-
109
-
110
-
111
-
112
-
113
-
114
-
115
-
116
-
117
-
118
-
119
-
120
-
121
-
122
-
123
-
124
-
125
-
126
-
127
-
128
-
129
-
130
-
131
-
132
-
133
-
134
-
135
-
136
-
137
-
138
-
139
-
140
-
141
-
142
-
143
-
144
-
 145
145 -
 146
146 -
 147
147 -
 148
148 -
 149
149 -
 150
150 -
 151
151 -
 152
152 -
 153
153 -
 154
154 -
 155
155 -
 156
156 -
 157
157 -
 158
158 -
 159
159 -
 160
160 -
 161
161 -
 162
162 -
 163
163 -
 164
164 -
 165
165 -
166
-
167
-
168
-
169
-
170
-
171
-
172
-
173
-
174
-
175
-
176
-
177
-
178
-
179
-
180
-
181
-
182
-
183
-
184
-
185
-
186
-
187
-
188
-
189
-
190
-
191
-
192
-
193
-
194
-
195
-
196
-
197
-
198
-
199
-
200
-
201
-
202
-
203
-
204
-
205
-
206
-
207
-
208
-
209
-
210
-
211
-
212
-
213
-
214
-
215
-
216
-
217
-
218
-
219
-
220
-
221
-
222
-
223
-
224
-
225
-
226
-
227
-
228
-
229
-
230
-
231
-
232
-
233
-
234
-
235
-
236
-
237
-
238
-
239
-
240
-
241
-
242
-
243
-
244
-
245
-
246
-
247
-
248
-
249
-
250
-
251
-
252
-
253
-
254
-
255
-
256
-
257
-
258
-
259
-
260
-
261
-
262
-
263
-
264
 |
 |

Table of Contents
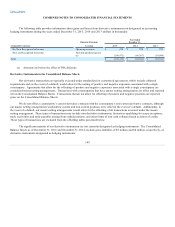
COMBINED NOTES TO CONSOLIDATED FINANCIAL STATEMENTS
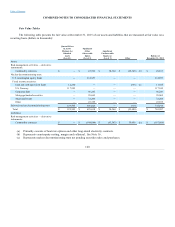
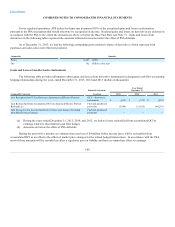
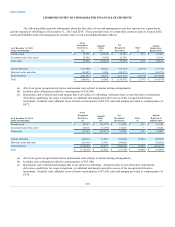
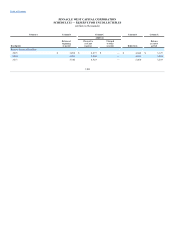
The following tables provide information about the fair value of our risk management activities reported on a gross basis,
and the impacts of offsetting as of December 31, 2015 and 2014. These amounts relate to commodity contracts and are located in the
assets and liabilities from risk management activities lines of our Consolidated Balance Sheets.
As of December 31, 2015:
(dollars in thousands)
Gross
Recognized
Derivatives
(a)
Amounts
Offset
(b)
Net
Recognized
Derivatives
Other
(c)
Amount
Reported on
Balance Sheet
Current assets
$ 37,396
$ (22,163)
$ 15,233
$ 672
$ 15,905
Investments and other assets
15,960
(3,854)
12,106
—
12,106
Total assets
53,356
(26,017)
27,339
672
28,011
Current liabilities
(113,560)
40,223
(73,337)
(4,379)
(77,716)
Deferred credits and other
(93,827)
3,854
(89,973)
—
(89,973)
Total liabilities
(207,387)
44,077
(163,310)
(4,379)
(167,689)
Total
$ (154,031)
$ 18,060
$ (135,971)
$ (3,707)
$ (139,678)
(a) All of our gross recognized derivative instruments were subject to master netting arrangements.
(b) Includes cash collateral provided to counterparties of $18,060.
(c) Represents cash collateral and cash margin that is not subject to offsetting. Amounts relate to non-derivative instruments,
derivatives qualifying for scope exceptions, or collateral and margin posted in excess of the recognized derivative
instrument. Includes cash collateral received from counterparties of $4,379, and cash margin provided to counterparties of
$672.
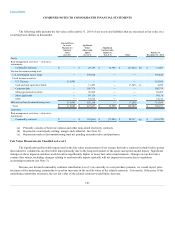
As of December 31, 2014:
(dollars in thousands)
Gross
Recognized
Derivatives
(a)
Amounts
Offset
(b)
Net
Recognized
Derivatives
Other
(c)
Amount
Reported on
Balance Sheet
Current assets
$ 28,557
$ (15,127)
$ 13,430
$ 355
$ 13,785
Investments and other assets
24,810
(7,190)
17,620
—
17,620
Total assets
53,367
(22,317)
31,050
355
31,405
Current liabilities
(86,055)
33,829
(52,226)
(7,443)
(59,669)
Deferred credits and other
(82,990)
32,388
(50,602)
—
(50,602)
Total liabilities
(169,045)
66,217
(102,828)
(7,443)
(110,271)
Total
$ (115,678)
$ 43,900
$ (71,778)
$ (7,088)
$ (78,866)
(a) All of our gross recognized derivative instruments were subject to master netting arrangements.
(b) Includes cash collateral provided to counterparties of $43,900.
(c) Represents cash collateral and margin that is not subject to offsetting. Amounts relate to non-derivative instruments,
derivatives qualifying for scope exceptions, or collateral and margin posted in excess of the recognized derivative
instrument. Includes cash collateral received from counterparties of $7,443, and cash margin provided to counterparties of
$355.
150