APS 2015 Annual Report Download - page 43
Download and view the complete annual report
Please find page 43 of the 2015 APS annual report below. You can navigate through the pages in the report by either clicking on the pages listed below, or by using the keyword search tool below to find specific information within the annual report.-
 1
1 -
 2
2 -
 3
3 -
 4
4 -
 5
5 -
 6
6 -
 7
7 -
 8
8 -
 9
9 -
 10
10 -
 11
11 -
 12
12 -
 13
13 -
 14
14 -
 15
15 -
 16
16 -
 17
17 -
 18
18 -
 19
19 -
 20
20 -
 21
21 -
 22
22 -
 23
23 -
 24
24 -
 25
25 -
 26
26 -
 27
27 -
 28
28 -
 29
29 -
 30
30 -
 31
31 -
 32
32 -
 33
33 -
 34
34 -
 35
35 -
 36
36 -
 37
37 -
 38
38 -
 39
39 -
 40
40 -
 41
41 -
 42
42 -
 43
43 -
 44
44 -
 45
45 -
 46
46 -
 47
47 -
 48
48 -
 49
49 -
 50
50 -
 51
51 -
 52
52 -
 53
53 -
 54
54 -
 55
55 -
 56
56 -
 57
57 -
 58
58 -
 59
59 -
 60
60 -
 61
61 -
 62
62 -
 63
63 -
 64
64 -
 65
65 -
 66
66 -
 67
67 -
 68
68 -
 69
69 -
 70
70 -
 71
71 -
 72
72 -
 73
73 -
 74
74 -
 75
75 -
 76
76 -
 77
77 -
 78
78 -
 79
79 -
 80
80 -
 81
81 -
 82
82 -
 83
83 -
 84
84 -
 85
85 -
 86
86 -
 87
87 -
 88
88 -
 89
89 -
 90
90 -
 91
91 -
 92
92 -
 93
93 -
 94
94 -
 95
95 -
 96
96 -
 97
97 -
 98
98 -
 99
99 -
 100
100 -
 101
101 -
 102
102 -
 103
103 -
 104
104 -
 105
105 -
 106
106 -
 107
107 -
 108
108 -
 109
109 -
 110
110 -
 111
111 -
 112
112 -
 113
113 -
 114
114 -
 115
115 -
 116
116 -
 117
117 -
 118
118 -
 119
119 -
 120
120 -
 121
121 -
 122
122 -
 123
123 -
 124
124 -
 125
125 -
 126
126 -
 127
127 -
 128
128 -
 129
129 -
 130
130 -
 131
131 -
 132
132 -
 133
133 -
 134
134 -
 135
135 -
 136
136 -
 137
137 -
 138
138 -
 139
139 -
 140
140 -
 141
141 -
 142
142 -
 143
143 -
 144
144 -
 145
145 -
 146
146 -
 147
147 -
 148
148 -
 149
149 -
 150
150 -
 151
151 -
 152
152 -
 153
153 -
 154
154 -
 155
155 -
 156
156 -
 157
157 -
 158
158 -
 159
159 -
 160
160 -
 161
161 -
 162
162 -
 163
163 -
 164
164 -
 165
165 -
 166
166 -
 167
167 -
 168
168 -
 169
169 -
 170
170 -
 171
171 -
 172
172 -
 173
173 -
 174
174 -
 175
175 -
 176
176 -
 177
177 -
 178
178 -
 179
179 -
 180
180 -
 181
181 -
 182
182 -
 183
183 -
 184
184 -
 185
185 -
 186
186 -
 187
187 -
 188
188 -
 189
189 -
 190
190 -
 191
191 -
 192
192 -
 193
193 -
 194
194 -
 195
195 -
 196
196 -
 197
197 -
 198
198 -
 199
199 -
 200
200 -
 201
201 -
 202
202 -
 203
203 -
 204
204 -
 205
205 -
 206
206 -
 207
207 -
 208
208 -
 209
209 -
 210
210 -
 211
211 -
 212
212 -
 213
213 -
 214
214 -
 215
215 -
 216
216 -
 217
217 -
 218
218 -
 219
219 -
 220
220 -
 221
221 -
 222
222 -
 223
223 -
 224
224 -
 225
225 -
 226
226 -
 227
227 -
 228
228 -
 229
229 -
 230
230 -
 231
231 -
 232
232 -
 233
233 -
 234
234 -
 235
235 -
 236
236 -
 237
237 -
 238
238 -
 239
239 -
 240
240 -
 241
241 -
 242
242 -
 243
243 -
 244
244 -
 245
245 -
 246
246 -
 247
247 -
 248
248 -
 249
249 -
 250
250 -
 251
251 -
 252
252 -
 253
253 -
 254
254 -
 255
255 -
 256
256 -
 257
257 -
 258
258 -
 259
259 -
 260
260 -
 261
261 -
 262
262 -
 263
263 -
 264
264
 |
 |

Table of Contents
(a) 100% unless otherwise noted.
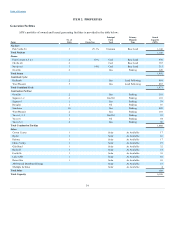
(b) See “Business of Arizona Public Service Company — Energy Sources and Resource Planning — Generation Facilities —
Nuclear” in Item 1 for details regarding leased interests in Palo Verde. The other participants are Salt River Project (17.49%),
SCE (15.8%), El Paso (15.8%), Public Service Company of New Mexico (10.2%), Southern California Public Power Authority
(5.91%), and Los Angeles Department of Water & Power (5.7%). The plant is operated by APS.
(c) The other participants are Salt River Project (10%), Public Service Company of New Mexico (13%), Tucson Electric Power
Company (7%) and El Paso (7%). The plant is operated by APS.
(d) Cholla Unit 2's last day of service was on October 1, 2015.
(e) The other participants are Salt River Project (21.7%), Nevada Power Company (11.3%), the United States Government (24.3%),
Tucson Electric Power Company (7.5%) and Los Angeles Department of Water & Power (21.2%). The plant is operated by Salt
River Project.
See “Business of Arizona Public Service Company — Environmental Matters” in Item 1 with respect to matters having a
possible impact on the operation of certain of APS’s generating facilities.
See “Business of Arizona Public Service Company” in Item 1 for a map detailing the location of APS’s major power plants and
principal transmission lines.
Transmission and Distribution Facilities
Current Facilities. APS’s transmission facilities consist of approximately 6,070 pole miles of overhead lines and approximately
49 miles of underground lines, 5,847 miles of which are located in Arizona. APS’s distribution facilities consist of approximately
11,077 miles of overhead lines and approximately 18,071 miles of underground primary cable, all of which are located in Arizona. APS
distribution facilities reflect an actual net gain of 169 miles in 2015. APS shares ownership of some of its transmission facilities with
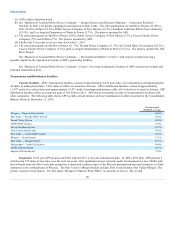
other companies. The following table shows APS’s jointly-owned interests in those transmission facilities recorded on the Consolidated
Balance Sheets at December 31, 2015:
Percent Owned
(Weighted-Average)
Morgan — Pinnacle Peak System 64.6%
Palo Verde — Estrella 500kV System 50.0%
Round Valley System 50.0%
ANPP 500kV System 33.4%
Navajo Southern System 22.7%
Four Corners Switchyards 49.8%
Palo Verde — Yuma 500kV System 19.3%
Phoenix — Mead System 17.1%
Palo Verde — Morgan System 87.7%
Hassayampa — North Gila System 80.0%
Cholla 500 Switchyard 85.7%
Saguaro 500 Switchyard 75.0%
Expansion. Each year APS prepares and files with the ACC a ten-year transmission plan. In APS’s 2015 plan, APS projects it
will develop 275 miles of new lines over the next ten years. One significant project currently under development is a new 500kV path
that will span from the Palo Verde hub around the western and northern edges of the Phoenix metropolitan area and terminate at a bulk
substation in the northeast part of Phoenix. The Palo Verde to Morgan System includes Palo Verde-Delaney-Sun Valley-Morgan. The
project consists of four phases. The first phase, Morgan to Pinnacle Peak 500kV, is currently in-service. The second
40
