APS 2015 Annual Report Download - page 159
Download and view the complete annual report
Please find page 159 of the 2015 APS annual report below. You can navigate through the pages in the report by either clicking on the pages listed below, or by using the keyword search tool below to find specific information within the annual report.-
 1
1 -
2
-
3
-
4
-
5
-
6
-
7
-
8
-
9
-
10
-
11
-
12
-
13
-
14
-
15
-
16
-
17
-
18
-
19
-
20
-
21
-
22
-
23
-
24
-
25
-
26
-
27
-
28
-
29
-
30
-
31
-
32
-
33
-
34
-
35
-
36
-
37
-
38
-
39
-
40
-
41
-
42
-
43
-
44
-
45
-
46
-
47
-
48
-
49
-
50
-
51
-
52
-
53
-
54
-
55
-
56
-
57
-
58
-
59
-
60
-
61
-
62
-
63
-
64
-
65
-
66
-
67
-
68
-
69
-
70
-
71
-
72
-
73
-
74
-
75
-
76
-
77
-
78
-
79
-
80
-
81
-
82
-
83
-
84
-
85
-
86
-
87
-
88
-
89
-
90
-
91
-
92
-
93
-
94
-
95
-
96
-
97
-
98
-
99
-
100
-
101
-
102
-
103
-
104
-
105
-
106
-
107
-
108
-
109
-
110
-
111
-
112
-
113
-
114
-
115
-
116
-
117
-
118
-
119
-
120
-
121
-
122
-
123
-
124
-
125
-
126
-
127
-
128
-
129
-
130
-
131
-
132
-
133
-
134
-
135
-
136
-
137
-
138
-
139
-
140
-
141
-
142
-
143
-
144
-
145
-
146
-
147
-
148
-
 149
149 -
 150
150 -
 151
151 -
 152
152 -
 153
153 -
 154
154 -
 155
155 -
 156
156 -
 157
157 -
 158
158 -
 159
159 -
 160
160 -
 161
161 -
 162
162 -
 163
163 -
 164
164 -
 165
165 -
 166
166 -
 167
167 -
 168
168 -
 169
169 -
170
-
171
-
172
-
173
-
174
-
175
-
176
-
177
-
178
-
179
-
180
-
181
-
182
-
183
-
184
-
185
-
186
-
187
-
188
-
189
-
190
-
191
-
192
-
193
-
194
-
195
-
196
-
197
-
198
-
199
-
200
-
201
-
202
-
203
-
204
-
205
-
206
-
207
-
208
-
209
-
210
-
211
-
212
-
213
-
214
-
215
-
216
-
217
-
218
-
219
-
220
-
221
-
222
-
223
-
224
-
225
-
226
-
227
-
228
-
229
-
230
-
231
-
232
-
233
-
234
-
235
-
236
-
237
-
238
-
239
-
240
-
241
-
242
-
243
-
244
-
245
-
246
-
247
-
248
-
249
-
250
-
251
-
252
-
253
-
254
-
255
-
256
-
257
-
258
-
259
-
260
-
261
-
262
-
263
-
264
 |
 |

Table of Contents
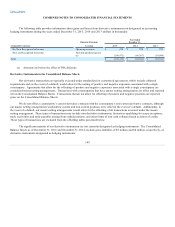
COMBINED NOTES TO CONSOLIDATED FINANCIAL STATEMENTS
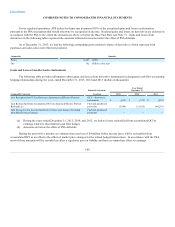
19. Nuclear Decommissioning Trusts
To fund the costs APS expects to incur to decommission Palo Verde, APS established external decommissioning trusts in
accordance with NRC regulations. Third-party investment managers are authorized to buy and sell securities per stated investment
guidelines. The trust funds are invested in fixed income securities and equity securities. APS classifies investments in
decommissioning trust funds as available for sale. As a result, we record the decommissioning trust funds at their fair value on our
Consolidated Balance Sheets. See Note 13 for a discussion of how fair value is determined and the classification of the nuclear
decommissioning trust investments within the fair value hierarchy. Because of the ability of APS to recover decommissioning costs in
rates and in accordance with the regulatory treatment for decommissioning trust funds, we have deferred realized and unrealized gains
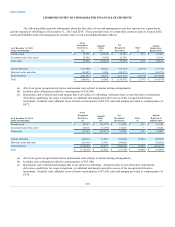
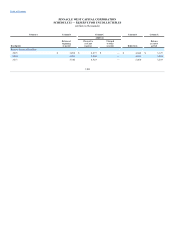
and losses (including other-than-temporary impairments on investment securities) in other regulatory liabilities. The following table
includes the unrealized gains and losses based on the original cost of the investment and summarizes the fair value of APS’s nuclear
decommissioning trust fund assets at December 31, 2015 and December 31, 2014 (dollars in thousands):
Fair Value
Total
Unrealized
Gains
Total
Unrealized
Losses
December 31, 2015
Equity securities $ 314,957
$ 157,098
$ (115)
Fixed income securities 420,574
11,955
(2,645)
Net payables (a) (335)
—
—
Total $ 735,196
$ 169,053
$ (2,760)
Fair Value
Total
Unrealized
Gains
Total
Unrealized
Losses
December 31, 2014
Equity securities $ 309,620
$ 159,274
$ (15)
Fixed income securities 411,491
17,260
(1,073)
Net payables (a) (7,245)
—
—
Total $ 713,866
$ 176,534
$ (1,088)
(a) Net payables relate to pending purchases and sales of securities.
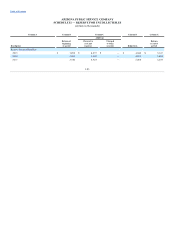
The costs of securities sold are determined on the basis of specific identification. The following table sets forth approximate
gains and losses and proceeds from the sale of securities by the nuclear decommissioning trust funds (dollars in thousands):
Year Ended December 31,
2015
2014
2013
Realized gains $ 5,189
$ 4,725
$ 5,459
Realized losses (6,225)
(4,525)
(6,706)
Proceeds from the sale of securities (a) 478,813
356,195
446,025
(a) Proceeds are reinvested in the trust.
154