APS 2015 Annual Report Download - page 153
Download and view the complete annual report
Please find page 153 of the 2015 APS annual report below. You can navigate through the pages in the report by either clicking on the pages listed below, or by using the keyword search tool below to find specific information within the annual report.-
 1
1 -
2
-
3
-
4
-
5
-
6
-
7
-
8
-
9
-
10
-
11
-
12
-
13
-
14
-
15
-
16
-
17
-
18
-
19
-
20
-
21
-
22
-
23
-
24
-
25
-
26
-
27
-
28
-
29
-
30
-
31
-
32
-
33
-
34
-
35
-
36
-
37
-
38
-
39
-
40
-
41
-
42
-
43
-
44
-
45
-
46
-
47
-
48
-
49
-
50
-
51
-
52
-
53
-
54
-
55
-
56
-
57
-
58
-
59
-
60
-
61
-
62
-
63
-
64
-
65
-
66
-
67
-
68
-
69
-
70
-
71
-
72
-
73
-
74
-
75
-
76
-
77
-
78
-
79
-
80
-
81
-
82
-
83
-
84
-
85
-
86
-
87
-
88
-
89
-
90
-
91
-
92
-
93
-
94
-
95
-
96
-
97
-
98
-
99
-
100
-
101
-
102
-
103
-
104
-
105
-
106
-
107
-
108
-
109
-
110
-
111
-
112
-
113
-
114
-
115
-
116
-
117
-
118
-
119
-
120
-
121
-
122
-
123
-
124
-
125
-
126
-
127
-
128
-
129
-
130
-
131
-
132
-
133
-
134
-
135
-
136
-
137
-
138
-
139
-
140
-
141
-
142
-
 143
143 -
 144
144 -
 145
145 -
 146
146 -
 147
147 -
 148
148 -
 149
149 -
 150
150 -
 151
151 -
 152
152 -
 153
153 -
 154
154 -
 155
155 -
 156
156 -
 157
157 -
 158
158 -
 159
159 -
 160
160 -
 161
161 -
 162
162 -
 163
163 -
164
-
165
-
166
-
167
-
168
-
169
-
170
-
171
-
172
-
173
-
174
-
175
-
176
-
177
-
178
-
179
-
180
-
181
-
182
-
183
-
184
-
185
-
186
-
187
-
188
-
189
-
190
-
191
-
192
-
193
-
194
-
195
-
196
-
197
-
198
-
199
-
200
-
201
-
202
-
203
-
204
-
205
-
206
-
207
-
208
-
209
-
210
-
211
-
212
-
213
-
214
-
215
-
216
-
217
-
218
-
219
-
220
-
221
-
222
-
223
-
224
-
225
-
226
-
227
-
228
-
229
-
230
-
231
-
232
-
233
-
234
-
235
-
236
-
237
-
238
-
239
-
240
-
241
-
242
-
243
-
244
-
245
-
246
-
247
-
248
-
249
-
250
-
251
-
252
-
253
-
254
-
255
-
256
-
257
-
258
-
259
-
260
-
261
-
262
-
263
-
264
 |
 |

Table of Contents
COMBINED NOTES TO CONSOLIDATED FINANCIAL STATEMENTS
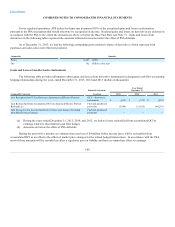
For its regulated operations, APS defers for future rate treatment 100% of the unrealized gains and losses on derivatives
pursuant to the PSA mechanism that would otherwise be recognized in income. Realized gains and losses on derivatives are deferred in
accordance with the PSA to the extent the amounts are above or below the Base Fuel Rate (see Note 3). Gains and losses from
derivatives in the following tables represent the amounts reflected in income before the effect of PSA deferrals.
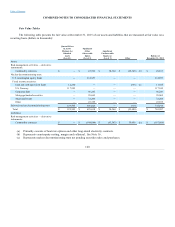
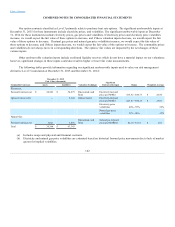
As of December 31, 2015, we had the following outstanding gross notional volume of derivatives, which represent both
purchases and sales (does not reflect net position):
Commodity
Quantity
Power
2,487
GWh
Gas
182
Billion cubic feet
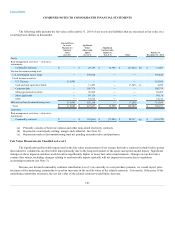
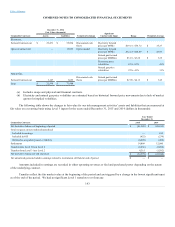
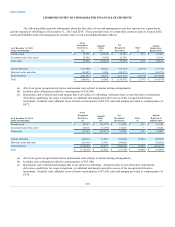
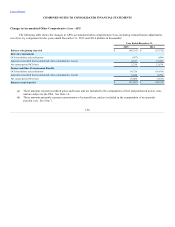
Gains and Losses from Derivative Instruments
The following table provides information about gains and losses from derivative instruments in designated cash flow accounting
hedging relationships during the years ended December 31, 2015, 2014 and 2013 (dollars in thousands):
Financial Statement
Year Ended
December 31,
Commodity Contracts
Location
2015
2014
2013
Loss Recognized in OCI on Derivative Instruments (Effective Portion)
OCI — derivative
instruments
$ (615)
$ (372)
$ (353)
Loss Reclassified from Accumulated OCI into Income (Effective Portion
Realized) (a)
Fuel and purchased
power (b)
(5,988)
(21,415)
(44,219)
Gain Recognized in Income (Ineffective Portion and Amount Excluded
from Effectiveness Testing)
Fuel and purchased
power (b)
—
—
—
(a) During the years ended December 31, 2015, 2014, and 2013, we had no losses reclassified from accumulated OCI to
earnings related to discontinued cash flow hedges.
(b) Amounts are before the effect of PSA deferrals.
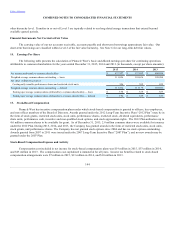
During the next twelve months, we estimate that a net loss of $4 million before income taxes will be reclassified from
accumulated OCI as an offset to the effect of market price changes for the related hedged transactions. In accordance with the PSA,
most of these amounts will be recorded as either a regulatory asset or liability and have no immediate effect on earnings.
148