APS 2015 Annual Report Download - page 116
Download and view the complete annual report
Please find page 116 of the 2015 APS annual report below. You can navigate through the pages in the report by either clicking on the pages listed below, or by using the keyword search tool below to find specific information within the annual report.-
 1
1 -
2
-
3
-
4
-
5
-
6
-
7
-
8
-
9
-
10
-
11
-
12
-
13
-
14
-
15
-
16
-
17
-
18
-
19
-
20
-
21
-
22
-
23
-
24
-
25
-
26
-
27
-
28
-
29
-
30
-
31
-
32
-
33
-
34
-
35
-
36
-
37
-
38
-
39
-
40
-
41
-
42
-
43
-
44
-
45
-
46
-
47
-
48
-
49
-
50
-
51
-
52
-
53
-
54
-
55
-
56
-
57
-
58
-
59
-
60
-
61
-
62
-
63
-
64
-
65
-
66
-
67
-
68
-
69
-
70
-
71
-
72
-
73
-
74
-
75
-
76
-
77
-
78
-
79
-
80
-
81
-
82
-
83
-
84
-
85
-
86
-
87
-
88
-
89
-
90
-
91
-
92
-
93
-
94
-
95
-
96
-
97
-
98
-
99
-
100
-
101
-
102
-
103
-
104
-
105
-
 106
106 -
 107
107 -
 108
108 -
 109
109 -
 110
110 -
 111
111 -
 112
112 -
 113
113 -
 114
114 -
 115
115 -
 116
116 -
 117
117 -
 118
118 -
 119
119 -
 120
120 -
 121
121 -
 122
122 -
 123
123 -
 124
124 -
 125
125 -
 126
126 -
127
-
128
-
129
-
130
-
131
-
132
-
133
-
134
-
135
-
136
-
137
-
138
-
139
-
140
-
141
-
142
-
143
-
144
-
145
-
146
-
147
-
148
-
149
-
150
-
151
-
152
-
153
-
154
-
155
-
156
-
157
-
158
-
159
-
160
-
161
-
162
-
163
-
164
-
165
-
166
-
167
-
168
-
169
-
170
-
171
-
172
-
173
-
174
-
175
-
176
-
177
-
178
-
179
-
180
-
181
-
182
-
183
-
184
-
185
-
186
-
187
-
188
-
189
-
190
-
191
-
192
-
193
-
194
-
195
-
196
-
197
-
198
-
199
-
200
-
201
-
202
-
203
-
204
-
205
-
206
-
207
-
208
-
209
-
210
-
211
-
212
-
213
-
214
-
215
-
216
-
217
-
218
-
219
-
220
-
221
-
222
-
223
-
224
-
225
-
226
-
227
-
228
-
229
-
230
-
231
-
232
-
233
-
234
-
235
-
236
-
237
-
238
-
239
-
240
-
241
-
242
-
243
-
244
-
245
-
246
-
247
-
248
-
249
-
250
-
251
-
252
-
253
-
254
-
255
-
256
-
257
-
258
-
259
-
260
-
261
-
262
-
263
-
264
 |
 |

Table of Contents
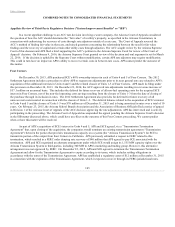
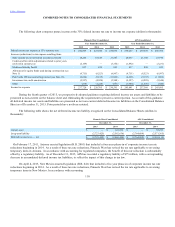
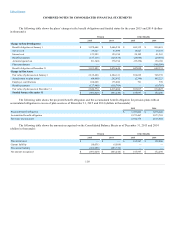
COMBINED NOTES TO CONSOLIDATED FINANCIAL STATEMENTS
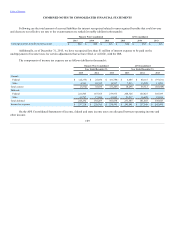
for regulated companies, the benefit of this rate reduction is substantially offset by a regulatory liability. As of December 31, 2015,
APS has recorded a regulatory liability of $2 million, with a corresponding decrease in accumulated deferred income tax liabilities, to
reflect the impact of this change in tax law.
The components of the net deferred income tax liability were as follows (dollars in thousands):
Pinnacle West Consolidated
APS Consolidated
December 31,
December 31,
2015
2014
2015
2014
DEFERRED TAX ASSETS
Risk management activities $ 70,498
$ 57,505
$ 70,498
$ 57,505
Regulatory liabilities:
Asset retirement obligation and removal costs 216,765
229,772
216,765
229,772
Unamortized investment tax credits 100,779
96,232
100,779
96,232
Other postretirement benefits 83,034
90,496
83,034
90,496
Other 60,707
60,409
60,707
60,409
Pension liabilities 191,028
205,227
181,787
194,541
Renewable energy incentives 60,956
65,169
60,956
65,169
Credit and loss carryforwards 59,557
68,347
—
—
Other 149,033
138,729
176,016
161,379
Total deferred tax assets 992,357
1,011,886
950,542
955,503
DEFERRED TAX LIABILITIES
Plant-related (3,116,752)
(2,958,369)
(3,116,752)
(2,958,369)
Risk management activities (10,626)
(12,171)
(10,626)
(12,171)
Other postretirement assets (71,737)
(59,170)
(70,986)
(58,495)
Regulatory assets:
Allowance for equity funds used during construction (54,110)
(48,286)
(54,110)
(48,286)
Deferred fuel and purchased power —
(2,498)
—
(2,498)
Deferred fuel and purchased power — mark-to-market (55,020)
(38,187)
(55,020)
(38,187)
Pension benefits (240,692)
(191,747)
(240,692)
(191,747)
Retired power plant costs (see Note 3) (53,420)
(57,255)
(53,420)
(57,255)
Other (108,441)
(99,123)
(108,441)
(99,123)
Other (4,984)
(5,484)
(4,984)
(5,484)
Total deferred tax liabilities (3,715,782)
(3,472,290)
(3,715,031)
(3,471,615)
Deferred income taxes — net $ (2,723,425)
$ (2,460,404)
$ (2,764,489)
$ (2,516,112)
As of December 31, 2015, the deferred tax assets for credit and loss carryforwards relate primarily to federal general business
credits of approximately $82 million, which first begin to expire in 2031, and other federal and state loss carryforwards of $3 million,
which first begin to expire in 2019. The credit and loss carryforwards amount above has been reduced by $26 million of unrecognized
tax benefits.
111