APS 2015 Annual Report Download - page 242
Download and view the complete annual report
Please find page 242 of the 2015 APS annual report below. You can navigate through the pages in the report by either clicking on the pages listed below, or by using the keyword search tool below to find specific information within the annual report.-
 1
1 -
2
-
3
-
4
-
5
-
6
-
7
-
8
-
9
-
10
-
11
-
12
-
13
-
14
-
15
-
16
-
17
-
18
-
19
-
20
-
21
-
22
-
23
-
24
-
25
-
26
-
27
-
28
-
29
-
30
-
31
-
32
-
33
-
34
-
35
-
36
-
37
-
38
-
39
-
40
-
41
-
42
-
43
-
44
-
45
-
46
-
47
-
48
-
49
-
50
-
51
-
52
-
53
-
54
-
55
-
56
-
57
-
58
-
59
-
60
-
61
-
62
-
63
-
64
-
65
-
66
-
67
-
68
-
69
-
70
-
71
-
72
-
73
-
74
-
75
-
76
-
77
-
78
-
79
-
80
-
81
-
82
-
83
-
84
-
85
-
86
-
87
-
88
-
89
-
90
-
91
-
92
-
93
-
94
-
95
-
96
-
97
-
98
-
99
-
100
-
101
-
102
-
103
-
104
-
105
-
106
-
107
-
108
-
109
-
110
-
111
-
112
-
113
-
114
-
115
-
116
-
117
-
118
-
119
-
120
-
121
-
122
-
123
-
124
-
125
-
126
-
127
-
128
-
129
-
130
-
131
-
132
-
133
-
134
-
135
-
136
-
137
-
138
-
139
-
140
-
141
-
142
-
143
-
144
-
145
-
146
-
147
-
148
-
149
-
150
-
151
-
152
-
153
-
154
-
155
-
156
-
157
-
158
-
159
-
160
-
161
-
162
-
163
-
164
-
165
-
166
-
167
-
168
-
169
-
170
-
171
-
172
-
173
-
174
-
175
-
176
-
177
-
178
-
179
-
180
-
181
-
182
-
183
-
184
-
185
-
186
-
187
-
188
-
189
-
190
-
191
-
192
-
193
-
194
-
195
-
196
-
197
-
198
-
199
-
200
-
201
-
202
-
203
-
204
-
205
-
206
-
207
-
208
-
209
-
210
-
211
-
212
-
213
-
214
-
215
-
216
-
217
-
218
-
219
-
220
-
221
-
222
-
223
-
224
-
225
-
226
-
227
-
228
-
229
-
230
-
231
-
 232
232 -
 233
233 -
 234
234 -
 235
235 -
 236
236 -
 237
237 -
 238
238 -
 239
239 -
 240
240 -
 241
241 -
 242
242 -
 243
243 -
 244
244 -
 245
245 -
 246
246 -
 247
247 -
 248
248 -
 249
249 -
 250
250 -
 251
251 -
 252
252 -
253
-
254
-
255
-
256
-
257
-
258
-
259
-
260
-
261
-
262
-
263
-
264
 |
 |

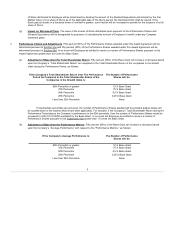
If intermediate percentiles are achieved, the number of Performance Shares awarded pursuant to this Subsection 5(b) will
be prorated (partial shares will be rounded down to the nearest whole share when applicable). For example, if the Company’s
Average Performance during the Performance Period places the Company’s performance in the 60th percentile, then the number
of Performance Shares would be increased to .60 (0.5 X 60/50) multiplied by the Base Grant. In no event will Employee be
entitled to receive a number of Performance Shares pursuant to this Subsection (b) greater than 1.0 times the Base Grant.
6. Definitions.
(a) Performance Metrics. The “Performance Metrics” for the Performance Period are: (i) the JD Power Residential National Large
Segment Survey for investor-owned utilities; (ii) the System Average Interruption Frequency Index (Major Events Excluded)
(“SAIFI”); (iii) Arizona Public Service Company’s customer to employee improvement ratio; (iv) the OSHA rate (All Incident Injury
Rate); (v) nuclear capacity factor; and (vi) coal capacity factor.
(1)With respect to the Performance Metric described in clause (i) of this Subsection 6(a), the JD Power Residential National Large
Segment Survey will provide data on an annual basis reflecting the Company’s percentile ranking, relative to other
participating companies.
(2)With respect to the Performance Metric described in clause (ii) of this Subsection 6(a), the Edison Electric Institute (“EEI”) will
provide data on an annual basis regarding the SAIFI result of the participating companies; the Company will calculate
its SAIFI result for the year in question and determine its percentile ranking based on the information provided by EEI.
(3)With respect to the Performance Metric described in clause (iii) of this Subsection 6(a), SNL, an independent third party data
system, will provide data on an annual basis regarding the customer and employee counts; the Company will use its
customer and employee counts for the year in question and determine its percentile ranking based on the information
provided by SNL. Only those companies whose customers and employees were included in the data provided by SNL
in each of the years of the Performance Period will be considered.
(4)With respect to the Performance Metric described in clause (iv) of this Subsection 6(a), EEI will provide data on an annual
basis regarding the OSHA rate of the participating companies; the Company will calculate its OSHA rate for the year in
question and determine its percentile ranking based on the information provided by EEI.
(5)With respect to the Performance Metric described in clause (v) of this Subsection 6(a), SNL will provide data on an annual
basis regarding the nuclear capacity factors of the participating nuclear plants; the Company will calculate its nuclear
capacity factor for the year in question and determine its percentile ranking based on the information provided by SNL.
Only those plants that were included in the data provided by SNL in each of the years of the Performance Period will
be considered.
(6)With respect to the Performance Metric described in clause (vi) of this Subsection 6(a), SNL will provide data on an annual
basis regarding the coal capacity factors of the participating coal plants; the Company will calculate its coal capacity
factor for the year in question and determine its percentile ranking based on the information provided by SNL. Only
those plants that were included in the data provided by SNL in each of the years of the Performance Period will be
considered.
4