APS 2015 Annual Report Download - page 164
Download and view the complete annual report
Please find page 164 of the 2015 APS annual report below. You can navigate through the pages in the report by either clicking on the pages listed below, or by using the keyword search tool below to find specific information within the annual report.-
 1
1 -
2
-
3
-
4
-
5
-
6
-
7
-
8
-
9
-
10
-
11
-
12
-
13
-
14
-
15
-
16
-
17
-
18
-
19
-
20
-
21
-
22
-
23
-
24
-
25
-
26
-
27
-
28
-
29
-
30
-
31
-
32
-
33
-
34
-
35
-
36
-
37
-
38
-
39
-
40
-
41
-
42
-
43
-
44
-
45
-
46
-
47
-
48
-
49
-
50
-
51
-
52
-
53
-
54
-
55
-
56
-
57
-
58
-
59
-
60
-
61
-
62
-
63
-
64
-
65
-
66
-
67
-
68
-
69
-
70
-
71
-
72
-
73
-
74
-
75
-
76
-
77
-
78
-
79
-
80
-
81
-
82
-
83
-
84
-
85
-
86
-
87
-
88
-
89
-
90
-
91
-
92
-
93
-
94
-
95
-
96
-
97
-
98
-
99
-
100
-
101
-
102
-
103
-
104
-
105
-
106
-
107
-
108
-
109
-
110
-
111
-
112
-
113
-
114
-
115
-
116
-
117
-
118
-
119
-
120
-
121
-
122
-
123
-
124
-
125
-
126
-
127
-
128
-
129
-
130
-
131
-
132
-
133
-
134
-
135
-
136
-
137
-
138
-
139
-
140
-
141
-
142
-
143
-
144
-
145
-
146
-
147
-
148
-
149
-
150
-
151
-
152
-
153
-
 154
154 -
 155
155 -
 156
156 -
 157
157 -
 158
158 -
 159
159 -
 160
160 -
 161
161 -
 162
162 -
 163
163 -
 164
164 -
 165
165 -
 166
166 -
 167
167 -
 168
168 -
 169
169 -
 170
170 -
 171
171 -
 172
172 -
 173
173 -
 174
174 -
175
-
176
-
177
-
178
-
179
-
180
-
181
-
182
-
183
-
184
-
185
-
186
-
187
-
188
-
189
-
190
-
191
-
192
-
193
-
194
-
195
-
196
-
197
-
198
-
199
-
200
-
201
-
202
-
203
-
204
-
205
-
206
-
207
-
208
-
209
-
210
-
211
-
212
-
213
-
214
-
215
-
216
-
217
-
218
-
219
-
220
-
221
-
222
-
223
-
224
-
225
-
226
-
227
-
228
-
229
-
230
-
231
-
232
-
233
-
234
-
235
-
236
-
237
-
238
-
239
-
240
-
241
-
242
-
243
-
244
-
245
-
246
-
247
-
248
-
249
-
250
-
251
-
252
-
253
-
254
-
255
-
256
-
257
-
258
-
259
-
260
-
261
-
262
-
263
-
264
 |
 |
Table of Contents
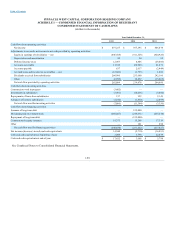
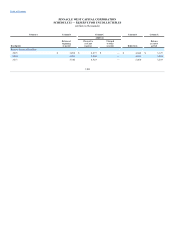
PINNACLE WEST CAPITAL CORPORATION HOLDING COMPANY
SCHEDULE I — CONDENSED FINANCIAL INFORMATION OF REGISTRANT
CONDENSED STATEMENTS OF CASH FLOWS
(dollars in thousands)
Year Ended December 31,
2015
2014
2013
Cash flows from operating activities
Net income $ 437,257
$ 397,595
$ 406,074
Adjustments to reconcile net income to net cash provided by operating activities:
Equity in earnings of subsidiaries — net (446,508)
(411,528)
(420,926)
Depreciation and amortization 92
94
95
Deferred income taxes 12,967
4,406
(28,806)
Accounts receivable 11,336
(22,945)
21,671
Accounts payable 637
2,017
(2,449)
Accrued taxes and income tax receivables — net (12,882)
(1,795)
1,402
Dividends received from subsidiaries 266,900
253,600
242,100
Other (6,995)
18,432
(15,065)
Net cash flow provided by operating activities 262,804
239,876
204,096
Cash flows from investing activities
Construction work in progress (3,462)
—
—
Investments in subsidiaries (3,491)
(10,236)
(3,400)
Repayments of loans from subsidiaries 157
322
2,149
Advances of loans to subsidiaries (1,010)
(1,450)
(2,099)
Net cash flow used for investing activities (7,806)
(11,364)
(3,350)
Cash flows from financing activities
Issuance of long-term debt —
125,000
—
Dividends paid on common stock (260,027)
(246,671)
(235,244)
Repayment of long-term debt —
(125,000)
—
Common stock equity issuance 19,373
15,288
17,319
Other —
161
298
Net cash flow used for financing activities (240,654)
(231,222)
(217,627)
Net increase (decrease) in cash and cash equivalents 14,344
(2,710)
(16,881)
Cash and cash equivalents at beginning of year 3,088
5,798
22,679
Cash and cash equivalents at end of year $ 17,432
$ 3,088
$ 5,798
See Combined Notes to Consolidated Financial Statements.
159