APS 2015 Annual Report Download - page 160
Download and view the complete annual report
Please find page 160 of the 2015 APS annual report below. You can navigate through the pages in the report by either clicking on the pages listed below, or by using the keyword search tool below to find specific information within the annual report.-
 1
1 -
2
-
3
-
4
-
5
-
6
-
7
-
8
-
9
-
10
-
11
-
12
-
13
-
14
-
15
-
16
-
17
-
18
-
19
-
20
-
21
-
22
-
23
-
24
-
25
-
26
-
27
-
28
-
29
-
30
-
31
-
32
-
33
-
34
-
35
-
36
-
37
-
38
-
39
-
40
-
41
-
42
-
43
-
44
-
45
-
46
-
47
-
48
-
49
-
50
-
51
-
52
-
53
-
54
-
55
-
56
-
57
-
58
-
59
-
60
-
61
-
62
-
63
-
64
-
65
-
66
-
67
-
68
-
69
-
70
-
71
-
72
-
73
-
74
-
75
-
76
-
77
-
78
-
79
-
80
-
81
-
82
-
83
-
84
-
85
-
86
-
87
-
88
-
89
-
90
-
91
-
92
-
93
-
94
-
95
-
96
-
97
-
98
-
99
-
100
-
101
-
102
-
103
-
104
-
105
-
106
-
107
-
108
-
109
-
110
-
111
-
112
-
113
-
114
-
115
-
116
-
117
-
118
-
119
-
120
-
121
-
122
-
123
-
124
-
125
-
126
-
127
-
128
-
129
-
130
-
131
-
132
-
133
-
134
-
135
-
136
-
137
-
138
-
139
-
140
-
141
-
142
-
143
-
144
-
145
-
146
-
147
-
148
-
149
-
 150
150 -
 151
151 -
 152
152 -
 153
153 -
 154
154 -
 155
155 -
 156
156 -
 157
157 -
 158
158 -
 159
159 -
 160
160 -
 161
161 -
 162
162 -
 163
163 -
 164
164 -
 165
165 -
 166
166 -
 167
167 -
 168
168 -
 169
169 -
 170
170 -
171
-
172
-
173
-
174
-
175
-
176
-
177
-
178
-
179
-
180
-
181
-
182
-
183
-
184
-
185
-
186
-
187
-
188
-
189
-
190
-
191
-
192
-
193
-
194
-
195
-
196
-
197
-
198
-
199
-
200
-
201
-
202
-
203
-
204
-
205
-
206
-
207
-
208
-
209
-
210
-
211
-
212
-
213
-
214
-
215
-
216
-
217
-
218
-
219
-
220
-
221
-
222
-
223
-
224
-
225
-
226
-
227
-
228
-
229
-
230
-
231
-
232
-
233
-
234
-
235
-
236
-
237
-
238
-
239
-
240
-
241
-
242
-
243
-
244
-
245
-
246
-
247
-
248
-
249
-
250
-
251
-
252
-
253
-
254
-
255
-
256
-
257
-
258
-
259
-
260
-
261
-
262
-
263
-
264
 |
 |

Table of Contents
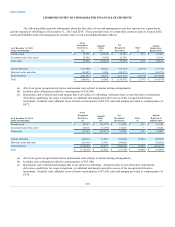
COMBINED NOTES TO CONSOLIDATED FINANCIAL STATEMENTS
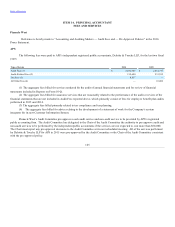
The fair value of fixed income securities, summarized by contractual maturities, at December 31, 2015 is as follows (dollars in
thousands):
Fair Value
Less than one year $ 14,001
1 year – 5 years 117,356
5 years – 10 years 114,769
Greater than 10 years 174,448
Total $ 420,574
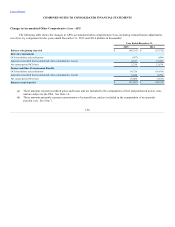
20. Changes in Accumulated Other Comprehensive Loss
The following table shows the changes in Pinnacle West's consolidated accumulated other comprehensive loss, including
reclassification adjustments, net of tax, by component for the years ended December 31, 2015 and 2014 (dollars in thousands):
Year Ended December 31,
2015
2014
Balance at beginning of period $ (68,141)
$ (78,053)
Derivative Instruments
OCI (loss) before reclassifications (957)
(810)
Amounts reclassified from accumulated other comprehensive loss (a) 4,187
13,483
Net current period OCI (loss) 3,230
12,673
Pension and Other Postretirement Benefits
OCI (loss) before reclassifications 16,980
(5,419)
Amounts reclassified from accumulated other comprehensive loss (b) 3,183
2,658
Net current period OCI (loss) 20,163
(2,761)
Balance at end of period $ (44,748)
$ (68,141)
(a) These amounts represent realized gains and losses and are included in the computation of fuel and purchased power costs
and are subject to the PSA. See Note 16.
(b) These amounts primarily represent amortization of actuarial loss, and are included in the computation of net periodic
pension cost. See Note 7.
155