APS 2015 Annual Report Download - page 63
Download and view the complete annual report
Please find page 63 of the 2015 APS annual report below. You can navigate through the pages in the report by either clicking on the pages listed below, or by using the keyword search tool below to find specific information within the annual report.-
 1
1 -
2
-
3
-
4
-
5
-
6
-
7
-
8
-
9
-
10
-
11
-
12
-
13
-
14
-
15
-
16
-
17
-
18
-
19
-
20
-
21
-
22
-
23
-
24
-
25
-
26
-
27
-
28
-
29
-
30
-
31
-
32
-
33
-
34
-
35
-
36
-
37
-
38
-
39
-
40
-
41
-
42
-
43
-
44
-
45
-
46
-
47
-
48
-
49
-
50
-
51
-
52
-
 53
53 -
 54
54 -
 55
55 -
 56
56 -
 57
57 -
 58
58 -
 59
59 -
 60
60 -
 61
61 -
 62
62 -
 63
63 -
 64
64 -
 65
65 -
 66
66 -
 67
67 -
 68
68 -
 69
69 -
 70
70 -
 71
71 -
 72
72 -
 73
73 -
74
-
75
-
76
-
77
-
78
-
79
-
80
-
81
-
82
-
83
-
84
-
85
-
86
-
87
-
88
-
89
-
90
-
91
-
92
-
93
-
94
-
95
-
96
-
97
-
98
-
99
-
100
-
101
-
102
-
103
-
104
-
105
-
106
-
107
-
108
-
109
-
110
-
111
-
112
-
113
-
114
-
115
-
116
-
117
-
118
-
119
-
120
-
121
-
122
-
123
-
124
-
125
-
126
-
127
-
128
-
129
-
130
-
131
-
132
-
133
-
134
-
135
-
136
-
137
-
138
-
139
-
140
-
141
-
142
-
143
-
144
-
145
-
146
-
147
-
148
-
149
-
150
-
151
-
152
-
153
-
154
-
155
-
156
-
157
-
158
-
159
-
160
-
161
-
162
-
163
-
164
-
165
-
166
-
167
-
168
-
169
-
170
-
171
-
172
-
173
-
174
-
175
-
176
-
177
-
178
-
179
-
180
-
181
-
182
-
183
-
184
-
185
-
186
-
187
-
188
-
189
-
190
-
191
-
192
-
193
-
194
-
195
-
196
-
197
-
198
-
199
-
200
-
201
-
202
-
203
-
204
-
205
-
206
-
207
-
208
-
209
-
210
-
211
-
212
-
213
-
214
-
215
-
216
-
217
-
218
-
219
-
220
-
221
-
222
-
223
-
224
-
225
-
226
-
227
-
228
-
229
-
230
-
231
-
232
-
233
-
234
-
235
-
236
-
237
-
238
-
239
-
240
-
241
-
242
-
243
-
244
-
245
-
246
-
247
-
248
-
249
-
250
-
251
-
252
-
253
-
254
-
255
-
256
-
257
-
258
-
259
-
260
-
261
-
262
-
263
-
264
 |
 |

Table of Contents
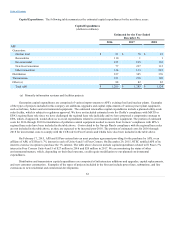
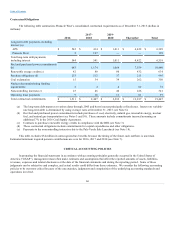
APS’s capital requirements consist primarily of capital expenditures and maturities of long-term debt. APS funds its capital
requirements with cash from operations and, to the extent necessary, external debt financing and equity infusions from Pinnacle West.
Many of APS’s current capital expenditure projects qualify for bonus depreciation. On December 18, 2015, President Obama
signed into law the Consolidated Appropriations Act, 2016 (H.R. 2029) which combined the tax and government funding bills (The
Protecting Americans from Tax Hikes Act and Omnibus Bill) containing an extension of bonus depreciation through 2019. Enactment
of this legislation is expected to generate approximately $375-$425 million of cash tax benefits over the next three years, which is
expected to be fully realized by APS and Pinnacle West Consolidated during this time frame. The cash generated by the extension of
bonus depreciation is an acceleration of the tax benefits that APS would have otherwise received over 20 years. At Pinnacle West
Consolidated, the extension of bonus depreciation will, in turn, delay until 2019 full cash realization of approximately $82 million of
currently unrealized Investment Tax Credits, which are recorded as a deferred tax asset on the Consolidated Balance Sheet as of
December 31, 2015.
Summary of Cash Flows
The following tables present net cash provided by (used for) operating, investing and financing activities for the years ended
December 31, 2015, 2014 and 2013 (dollars in millions):
Pinnacle West Consolidated
2015
2014
2013
Net cash flow provided by operating activities $ 1,094
$ 1,100
$ 1,153
Net cash flow used for investing activities (1,066)
(923)
(1,009)
Net cash flow provided by (used for) financing activities 4
(179)
(161)
Net increase (decrease) in cash and cash equivalents $ 32
$ (2)
$ (17)
Arizona Public Service Company
2015
2014
2013
Net cash flow provided by operating activities $ 1,100
$ 1,124
$ 1,194
Net cash flow used for investing activities (1,060)
(922)
(1,009)
Net cash flow used for financing activities (22)
(201)
(185)
Net increase in cash and cash equivalents $ 18
$ 1
$ —
Operating Cash Flows
2015 Compared with 2014. Pinnacle West’s consolidated net cash provided by operating activities was $1,094 million in 2015
compared to $1,100 million in 2014, a decrease of $6 million in net cash provided. The decrease is primarily related to a $135 million
income tax refund received in the first quarter of 2014, which is partially offset by a $48 million change in cash collateral posted, and
other changes in working capital including increased cash receipts for the Four Corners-related rate change of $56 million.
2014 Compared with 2013. Pinnacle West’s consolidated net cash provided by operating activities was $1,100 million in 2014
compared to $1,153 million in 2013, a decrease of $53 million in net cash provided. The decrease is primarily related to $99 million in
higher fuel and purchased power costs, a $39 million increase in cash collateral posted, $34 million of higher pension contributions in
2014, and other changes in working capital. The decrease is partially offset by a $121 million increase in income tax refunds net of
payments (primarily related to a $135 million income tax refund received in the first quarter of 2014). APS's
60