APS 2015 Annual Report Download - page 126
Download and view the complete annual report
Please find page 126 of the 2015 APS annual report below. You can navigate through the pages in the report by either clicking on the pages listed below, or by using the keyword search tool below to find specific information within the annual report.-
 1
1 -
2
-
3
-
4
-
5
-
6
-
7
-
8
-
9
-
10
-
11
-
12
-
13
-
14
-
15
-
16
-
17
-
18
-
19
-
20
-
21
-
22
-
23
-
24
-
25
-
26
-
27
-
28
-
29
-
30
-
31
-
32
-
33
-
34
-
35
-
36
-
37
-
38
-
39
-
40
-
41
-
42
-
43
-
44
-
45
-
46
-
47
-
48
-
49
-
50
-
51
-
52
-
53
-
54
-
55
-
56
-
57
-
58
-
59
-
60
-
61
-
62
-
63
-
64
-
65
-
66
-
67
-
68
-
69
-
70
-
71
-
72
-
73
-
74
-
75
-
76
-
77
-
78
-
79
-
80
-
81
-
82
-
83
-
84
-
85
-
86
-
87
-
88
-
89
-
90
-
91
-
92
-
93
-
94
-
95
-
96
-
97
-
98
-
99
-
100
-
101
-
102
-
103
-
104
-
105
-
106
-
107
-
108
-
109
-
110
-
111
-
112
-
113
-
114
-
115
-
 116
116 -
 117
117 -
 118
118 -
 119
119 -
 120
120 -
 121
121 -
 122
122 -
 123
123 -
 124
124 -
 125
125 -
 126
126 -
 127
127 -
 128
128 -
 129
129 -
 130
130 -
 131
131 -
 132
132 -
 133
133 -
 134
134 -
 135
135 -
 136
136 -
137
-
138
-
139
-
140
-
141
-
142
-
143
-
144
-
145
-
146
-
147
-
148
-
149
-
150
-
151
-
152
-
153
-
154
-
155
-
156
-
157
-
158
-
159
-
160
-
161
-
162
-
163
-
164
-
165
-
166
-
167
-
168
-
169
-
170
-
171
-
172
-
173
-
174
-
175
-
176
-
177
-
178
-
179
-
180
-
181
-
182
-
183
-
184
-
185
-
186
-
187
-
188
-
189
-
190
-
191
-
192
-
193
-
194
-
195
-
196
-
197
-
198
-
199
-
200
-
201
-
202
-
203
-
204
-
205
-
206
-
207
-
208
-
209
-
210
-
211
-
212
-
213
-
214
-
215
-
216
-
217
-
218
-
219
-
220
-
221
-
222
-
223
-
224
-
225
-
226
-
227
-
228
-
229
-
230
-
231
-
232
-
233
-
234
-
235
-
236
-
237
-
238
-
239
-
240
-
241
-
242
-
243
-
244
-
245
-
246
-
247
-
248
-
249
-
250
-
251
-
252
-
253
-
254
-
255
-
256
-
257
-
258
-
259
-
260
-
261
-
262
-
263
-
264
 |
 |

Table of Contents
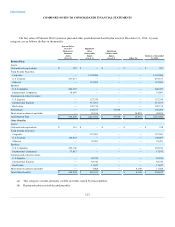
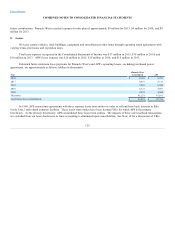
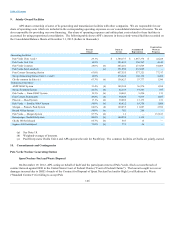
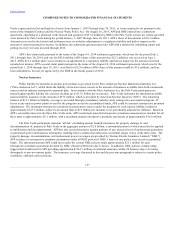
COMBINED NOTES TO CONSOLIDATED FINANCIAL STATEMENTS
provide for a specific mix of long-term fixed income assets, but does expect the average credit quality of such assets to be investment
grade. As of December 31, 2015, long-term fixed income assets represented 60% of total pension plan assets, and return-generating
assets represented 40% of total pension plan assets.
As of December 31, 2015, the asset allocation for other postretirement benefit plan assets is governed by the IPS for those plans,
which provides for different asset allocation target mixes depending on the characteristics of the liability. Some of these asset allocation
target mixes vary with the plan’s funded status. As of December 31, 2015, investment in fixed income assets represented 40% of the
other postretirement benefit plan total assets, and non-fixed income assets represented 60% of the other postretirement benefit plan’s
assets. Fixed income assets are primarily invested in corporate bonds of investment-grade U.S. issuers, and U.S. Treasuries. Non-fixed
income assets are primarily invested in large cap U.S. equities in diverse industries, and international equities in both emerging and
developed markets.
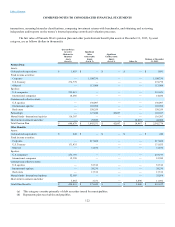
See Note 13 for a discussion on the fair value hierarchy and how fair value methodologies are applied. The plans invest directly
in fixed income and equity securities, in addition to investing indirectly in fixed income securities, equity securities and real estate
through the use of mutual funds, partnerships and common and collective trusts. Equity securities held directly by the plans are valued
using quoted active market prices from the published exchange on which the equity security trades, and are classified as Level 1. Fixed
income securities issued by the U.S. Treasury held directly by the plans are valued using quoted active market prices, and are classified
as Level 1. Fixed income securities issued by corporations, municipalities, and other agencies are primarily valued using quoted
inactive market prices, or quoted active market prices for similar securities, or by utilizing calculations which incorporate observable
inputs such as yield, maturity and credit quality. These instruments are classified as Level 2.
Mutual funds, partnerships, and common and collective trusts are valued utilizing a net asset value (NAV) concept or its
equivalent. Exchange traded mutual funds, are classified as Level 1, as the valuation for these instruments is based on the active market
in which the fund trades.
Common and collective trusts, are maintained by banks or investment companies and hold certain investments in accordance
with a stated set of objectives (such as tracking the performance of the S&P 500 Index). The trust's shares are offered to a limited group
of investors, and are not traded in an active market. The NAV for trusts investing in exchange traded equities is derived from the quoted
active market prices of the underlying securities held by the trusts. The NAV for trusts investing in real estate is derived from the
appraised values of the trust's underlying real estate assets. As of December 31, 2015, the plans were able to transact in the common
and collective trusts at NAV and classifies these investments as Level 2.
Investments in partnerships are also valued using the concept of NAV, which is derived from the value of the partnerships'
underlying assets. The plan's partnerships holdings relate to investments in high-yield fixed income instruments and assets of privately
held portfolio companies. Certain partnerships also include funding commitments that may require the plan to contribute up to $75
million to these partnerships; as of December 31, 2015, approximately $40 million of these commitments have been funded.
Partnerships are classified as Level 2 if the plan is able to transact in the partnership at the NAV, otherwise the partnership is classified
as Level 3.
The plans’ trustee provides valuation of our plan assets by using pricing services that utilize methodologies described to
determine fair market value. We have internal control procedures to ensure this information is consistent with fair value accounting
guidance. These procedures include assessing valuations using an independent pricing source, verifying that pricing can be supported
by actual recent market
121