APS 2015 Annual Report Download - page 127
Download and view the complete annual report
Please find page 127 of the 2015 APS annual report below. You can navigate through the pages in the report by either clicking on the pages listed below, or by using the keyword search tool below to find specific information within the annual report.-
 1
1 -
2
-
3
-
4
-
5
-
6
-
7
-
8
-
9
-
10
-
11
-
12
-
13
-
14
-
15
-
16
-
17
-
18
-
19
-
20
-
21
-
22
-
23
-
24
-
25
-
26
-
27
-
28
-
29
-
30
-
31
-
32
-
33
-
34
-
35
-
36
-
37
-
38
-
39
-
40
-
41
-
42
-
43
-
44
-
45
-
46
-
47
-
48
-
49
-
50
-
51
-
52
-
53
-
54
-
55
-
56
-
57
-
58
-
59
-
60
-
61
-
62
-
63
-
64
-
65
-
66
-
67
-
68
-
69
-
70
-
71
-
72
-
73
-
74
-
75
-
76
-
77
-
78
-
79
-
80
-
81
-
82
-
83
-
84
-
85
-
86
-
87
-
88
-
89
-
90
-
91
-
92
-
93
-
94
-
95
-
96
-
97
-
98
-
99
-
100
-
101
-
102
-
103
-
104
-
105
-
106
-
107
-
108
-
109
-
110
-
111
-
112
-
113
-
114
-
115
-
116
-
 117
117 -
 118
118 -
 119
119 -
 120
120 -
 121
121 -
 122
122 -
 123
123 -
 124
124 -
 125
125 -
 126
126 -
 127
127 -
 128
128 -
 129
129 -
 130
130 -
 131
131 -
 132
132 -
 133
133 -
 134
134 -
 135
135 -
 136
136 -
 137
137 -
138
-
139
-
140
-
141
-
142
-
143
-
144
-
145
-
146
-
147
-
148
-
149
-
150
-
151
-
152
-
153
-
154
-
155
-
156
-
157
-
158
-
159
-
160
-
161
-
162
-
163
-
164
-
165
-
166
-
167
-
168
-
169
-
170
-
171
-
172
-
173
-
174
-
175
-
176
-
177
-
178
-
179
-
180
-
181
-
182
-
183
-
184
-
185
-
186
-
187
-
188
-
189
-
190
-
191
-
192
-
193
-
194
-
195
-
196
-
197
-
198
-
199
-
200
-
201
-
202
-
203
-
204
-
205
-
206
-
207
-
208
-
209
-
210
-
211
-
212
-
213
-
214
-
215
-
216
-
217
-
218
-
219
-
220
-
221
-
222
-
223
-
224
-
225
-
226
-
227
-
228
-
229
-
230
-
231
-
232
-
233
-
234
-
235
-
236
-
237
-
238
-
239
-
240
-
241
-
242
-
243
-
244
-
245
-
246
-
247
-
248
-
249
-
250
-
251
-
252
-
253
-
254
-
255
-
256
-
257
-
258
-
259
-
260
-
261
-
262
-
263
-
264
 |
 |

Table of Contents
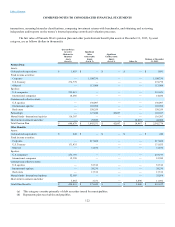
COMBINED NOTES TO CONSOLIDATED FINANCIAL STATEMENTS
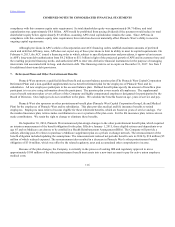
transactions, assessing hierarchy classifications, comparing investment returns with benchmarks, and obtaining and reviewing
independent audit reports on the trustee’s internal operating controls and valuation processes.
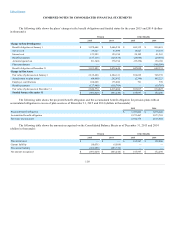
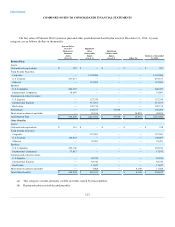
The fair value of Pinnacle West’s pension plan and other postretirement benefit plan assets at December 31, 2015, by asset
category, are as follows (dollars in thousands):
Quoted Prices
in Active
Markets for
Identical
Assets
(Level 1)
Significant
Other
Observable
Inputs
(Level 2)
Significant
Unobservable
Inputs
(Level 3)
Other (b)
Balance at December
31, 2015
Pension Plan:
Assets:
Cash and cash equivalents $ 1,893
$ —
$ —
$ —
$ 1,893
Fixed income securities:
Corporate —
1,108,736
—
—
1,108,736
U.S. Treasury 274,778
—
—
—
274,778
Other (a) —
113,008
—
—
113,008
Equities:
U.S. companies 233,021
—
—
—
233,021
International companies 14,680
—
—
—
14,680
Common and collective trusts:
U.S. equities —
130,097
—
—
130,097
International equities —
185,892
—
—
185,892
Real estate —
150,359
—
—
150,359
Partnerships —
127,840
42,097
—
169,937
Mutual funds - International equities 116,307
—
—
—
116,307
Short-term investments and other —
29,599
—
14,467
44,066
Total Pension Plan $ 640,679
$ 1,845,531
$ 42,097
$ 14,467
$ 2,542,774
Other Benefits:
Assets:
Cash and cash equivalents $ 240
$ —
$ —
$ —
$ 240
Fixed income securities:
Corporate —
217,026
—
—
217,026
U.S. Treasury 131,435
—
—
—
131,435
Other (a) —
31,106
—
—
31,106
Equities:
U.S. companies 253,193
—
—
—
253,193
International companies 12,390
—
—
—
12,390
Common and collective trusts:
U.S. equities —
81,516
—
—
81,516
International equities —
28,539
—
—
28,539
Real estate —
13,512
—
—
13,512
Mutual funds - International equities 52,568
—
—
—
52,568
Short-term investments and other 5,065
3,331
—
3,096
11,492
Total Other Benefits $ 454,891
$ 375,030
$ —
$ 3,096
$ 833,017
(a) This category consists primarily of debt securities issued by municipalities.
(b) Represents plan receivables and payables.
122