APS 2015 Annual Report Download - page 129
Download and view the complete annual report
Please find page 129 of the 2015 APS annual report below. You can navigate through the pages in the report by either clicking on the pages listed below, or by using the keyword search tool below to find specific information within the annual report.-
 1
1 -
2
-
3
-
4
-
5
-
6
-
7
-
8
-
9
-
10
-
11
-
12
-
13
-
14
-
15
-
16
-
17
-
18
-
19
-
20
-
21
-
22
-
23
-
24
-
25
-
26
-
27
-
28
-
29
-
30
-
31
-
32
-
33
-
34
-
35
-
36
-
37
-
38
-
39
-
40
-
41
-
42
-
43
-
44
-
45
-
46
-
47
-
48
-
49
-
50
-
51
-
52
-
53
-
54
-
55
-
56
-
57
-
58
-
59
-
60
-
61
-
62
-
63
-
64
-
65
-
66
-
67
-
68
-
69
-
70
-
71
-
72
-
73
-
74
-
75
-
76
-
77
-
78
-
79
-
80
-
81
-
82
-
83
-
84
-
85
-
86
-
87
-
88
-
89
-
90
-
91
-
92
-
93
-
94
-
95
-
96
-
97
-
98
-
99
-
100
-
101
-
102
-
103
-
104
-
105
-
106
-
107
-
108
-
109
-
110
-
111
-
112
-
113
-
114
-
115
-
116
-
117
-
118
-
 119
119 -
 120
120 -
 121
121 -
 122
122 -
 123
123 -
 124
124 -
 125
125 -
 126
126 -
 127
127 -
 128
128 -
 129
129 -
 130
130 -
 131
131 -
 132
132 -
 133
133 -
 134
134 -
 135
135 -
 136
136 -
 137
137 -
 138
138 -
 139
139 -
140
-
141
-
142
-
143
-
144
-
145
-
146
-
147
-
148
-
149
-
150
-
151
-
152
-
153
-
154
-
155
-
156
-
157
-
158
-
159
-
160
-
161
-
162
-
163
-
164
-
165
-
166
-
167
-
168
-
169
-
170
-
171
-
172
-
173
-
174
-
175
-
176
-
177
-
178
-
179
-
180
-
181
-
182
-
183
-
184
-
185
-
186
-
187
-
188
-
189
-
190
-
191
-
192
-
193
-
194
-
195
-
196
-
197
-
198
-
199
-
200
-
201
-
202
-
203
-
204
-
205
-
206
-
207
-
208
-
209
-
210
-
211
-
212
-
213
-
214
-
215
-
216
-
217
-
218
-
219
-
220
-
221
-
222
-
223
-
224
-
225
-
226
-
227
-
228
-
229
-
230
-
231
-
232
-
233
-
234
-
235
-
236
-
237
-
238
-
239
-
240
-
241
-
242
-
243
-
244
-
245
-
246
-
247
-
248
-
249
-
250
-
251
-
252
-
253
-
254
-
255
-
256
-
257
-
258
-
259
-
260
-
261
-
262
-
263
-
264
 |
 |

Table of Contents
COMBINED NOTES TO CONSOLIDATED FINANCIAL STATEMENTS
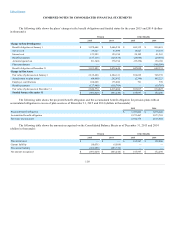
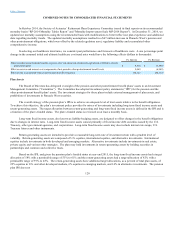
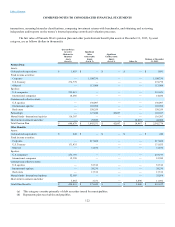
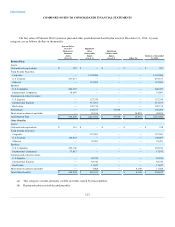
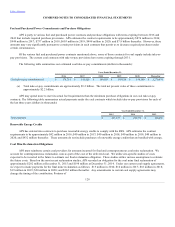
The following table shows the changes in fair value for assets that are measured at fair value on a recurring basis using
significant unobservable inputs (Level 3) for the year ended December 31, 2015 and 2014 (dollars in thousands):
Pension
Partnerships
2015
2014
Beginning balance at January 1
$ 27,929
$ 8,660
Actual return on assets still held at December 31
2,789
927
Purchases
13,187
19,984
Sales
(1,808)
(1,642)
Transfers in and/or out of Level 3
—
—
Ending balance at December 31
$ 42,097
$ 27,929
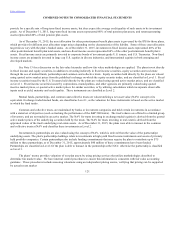
Contributions
Future year contribution amounts are dependent on plan asset performance and plan actuarial assumptions. We made
contributions to our pension plan totaling $100 million in 2015, $175 million in 2014, and $141 million in 2013. The minimum
required contributions for the pension plan are zero for the next three years. We expect to make voluntary contributions up to a total of
$300 million during the 2016-2018 period. With regard to contributions to our other postretirement benefit plans, we made a
contribution of $1 million in 2015, $1 million in 2014, and $14 million in 2013. We expect to make contributions of approximately $1
million in each of the next three years to our other postretirement benefit plans. APS funds its share of the contributions. APS’s share of
the pension plan contribution was $100 million in 2015, $175 million in 2014, and $140 million in 2013. APS’s share of the
contributions to the other postretirement benefit plan was $1 million in 2015, $1 million in 2014, and $14 million in 2013.
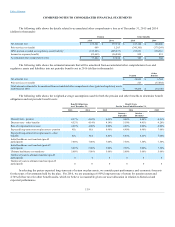
Estimated Future Benefit Payments
Benefit payments, which reflect estimated future employee service, for the next five years and the succeeding five years
thereafter, are estimated to be as follows (dollars in thousands):
Year
Pension
Other Benefits
2016
$ 152,146
$ 26,468
2017
171,005
28,444
2018
170,534
30,490
2019
180,700
32,438
2020
188,988
33,982
Years 2021-2025
1,023,451
184,335
Electric plant participants contribute to the above amounts in accordance with their respective participation agreements.
Employee Savings Plan Benefits
Pinnacle West sponsors a defined contribution savings plan for eligible employees of Pinnacle West and its subsidiaries. In
2015, costs related to APS’s employees represented 99% of the total cost of this plan. In a defined contribution savings plan, the
benefits a participant receives result from regular contributions participants make to their own individual account, the Company’s
matching contributions and earnings or losses on their investments. Under this plan, the Company matches a percentage of the
participants’ contributions in cash which is then invested in the same investment mix as participants elect to invest their own
124