APS 2015 Annual Report Download - page 124
Download and view the complete annual report
Please find page 124 of the 2015 APS annual report below. You can navigate through the pages in the report by either clicking on the pages listed below, or by using the keyword search tool below to find specific information within the annual report.-
 1
1 -
2
-
3
-
4
-
5
-
6
-
7
-
8
-
9
-
10
-
11
-
12
-
13
-
14
-
15
-
16
-
17
-
18
-
19
-
20
-
21
-
22
-
23
-
24
-
25
-
26
-
27
-
28
-
29
-
30
-
31
-
32
-
33
-
34
-
35
-
36
-
37
-
38
-
39
-
40
-
41
-
42
-
43
-
44
-
45
-
46
-
47
-
48
-
49
-
50
-
51
-
52
-
53
-
54
-
55
-
56
-
57
-
58
-
59
-
60
-
61
-
62
-
63
-
64
-
65
-
66
-
67
-
68
-
69
-
70
-
71
-
72
-
73
-
74
-
75
-
76
-
77
-
78
-
79
-
80
-
81
-
82
-
83
-
84
-
85
-
86
-
87
-
88
-
89
-
90
-
91
-
92
-
93
-
94
-
95
-
96
-
97
-
98
-
99
-
100
-
101
-
102
-
103
-
104
-
105
-
106
-
107
-
108
-
109
-
110
-
111
-
112
-
113
-
 114
114 -
 115
115 -
 116
116 -
 117
117 -
 118
118 -
 119
119 -
 120
120 -
 121
121 -
 122
122 -
 123
123 -
 124
124 -
 125
125 -
 126
126 -
 127
127 -
 128
128 -
 129
129 -
 130
130 -
 131
131 -
 132
132 -
 133
133 -
 134
134 -
135
-
136
-
137
-
138
-
139
-
140
-
141
-
142
-
143
-
144
-
145
-
146
-
147
-
148
-
149
-
150
-
151
-
152
-
153
-
154
-
155
-
156
-
157
-
158
-
159
-
160
-
161
-
162
-
163
-
164
-
165
-
166
-
167
-
168
-
169
-
170
-
171
-
172
-
173
-
174
-
175
-
176
-
177
-
178
-
179
-
180
-
181
-
182
-
183
-
184
-
185
-
186
-
187
-
188
-
189
-
190
-
191
-
192
-
193
-
194
-
195
-
196
-
197
-
198
-
199
-
200
-
201
-
202
-
203
-
204
-
205
-
206
-
207
-
208
-
209
-
210
-
211
-
212
-
213
-
214
-
215
-
216
-
217
-
218
-
219
-
220
-
221
-
222
-
223
-
224
-
225
-
226
-
227
-
228
-
229
-
230
-
231
-
232
-
233
-
234
-
235
-
236
-
237
-
238
-
239
-
240
-
241
-
242
-
243
-
244
-
245
-
246
-
247
-
248
-
249
-
250
-
251
-
252
-
253
-
254
-
255
-
256
-
257
-
258
-
259
-
260
-
261
-
262
-
263
-
264
 |
 |

Table of Contents
COMBINED NOTES TO CONSOLIDATED FINANCIAL STATEMENTS
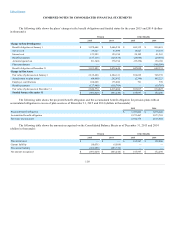
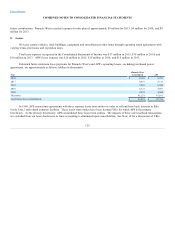
The following table shows the details related to accumulated other comprehensive loss as of December 31, 2015 and 2014
(dollars in thousands):
Pension
Other Benefits
2015
2014
2015
2014
Net actuarial loss $ 679,501
$ 577,976
$ 127,124
$ 148,006
Prior service cost (credit) 609
1,203
(341,301)
(379,269)
APS’s portion recorded as a regulatory (asset) liability (619,223)
(485,037)
213,621
230,916
Income tax expense (benefit) (23,663)
(36,890)
925
851
Accumulated other comprehensive loss $ 37,224
$ 57,252
$ 369
$ 504
The following table shows the estimated amounts that will be amortized from accumulated other comprehensive loss and
regulatory assets and liabilities into net periodic benefit cost in 2016 (dollars in thousands):
Pension
Other
Benefits
Net actuarial loss $ 38,923
$ 3,784
Prior service cost (credit) 527
(37,884)
Total amounts estimated to be amortized from accumulated other comprehensive loss (gain) and regulatory assets
(liabilities) in 2016 $ 39,450
$ (34,100)
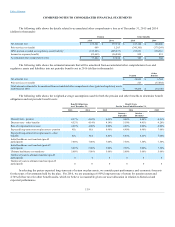
The following table shows the weighted-average assumptions used for both the pension and other benefits to determine benefit
obligations and net periodic benefit costs:
Benefit Obligations
As of December 31,
Benefit Costs
For the Years Ended December 31,
2015
2014
2015
2014
2013
January -
September
October -
December
Discount rate – pension 4.37%
4.02%
4.02%
4.88% 4.88%
4.01%
Discount rate – other benefits 4.52%
4.14%
4.14%
5.10% 4.41%
4.20%
Rate of compensation increase 4.00%
4.00%
4.00%
4.00% 4.00%
4.00%
Expected long-term return on plan assets - pension N/A
N/A
6.90%
6.90% 6.90%
7.00%
Expected long-term return on plan assets - other
benefits N/A
N/A
4.45%
6.80% 4.25%
7.00%
Initial healthcare cost trend rate (pre-65
participants) 7.00%
7.00%
7.00%
7.50% 7.50%
7.50%
Initial healthcare cost trend rate (post-65
participants) 5.00%
5.00%
5.00%
7.50% 5.00%
7.50%
Ultimate healthcare cost trend rate 5.00%
5.00%
5.00%
5.00% 5.00%
5.00%
Number of years to ultimate trend rate (pre-65
participants) 4
4
4
4 4
4
Number of years to ultimate trend rate (post-65
participants) 0
0
0
4 0
4
In selecting the pretax expected long-term rate of return on plan assets, we consider past performance and economic forecasts
for the types of investments held by the plan. For 2016, we are assuming a 6.90% long-term rate of return for pension assets and
4.74% (before tax) for other benefit assets, which we believe is reasonable given our asset allocation in relation to historical and
expected performance.
119