APS 2015 Annual Report Download - page 122
Download and view the complete annual report
Please find page 122 of the 2015 APS annual report below. You can navigate through the pages in the report by either clicking on the pages listed below, or by using the keyword search tool below to find specific information within the annual report.-
 1
1 -
2
-
3
-
4
-
5
-
6
-
7
-
8
-
9
-
10
-
11
-
12
-
13
-
14
-
15
-
16
-
17
-
18
-
19
-
20
-
21
-
22
-
23
-
24
-
25
-
26
-
27
-
28
-
29
-
30
-
31
-
32
-
33
-
34
-
35
-
36
-
37
-
38
-
39
-
40
-
41
-
42
-
43
-
44
-
45
-
46
-
47
-
48
-
49
-
50
-
51
-
52
-
53
-
54
-
55
-
56
-
57
-
58
-
59
-
60
-
61
-
62
-
63
-
64
-
65
-
66
-
67
-
68
-
69
-
70
-
71
-
72
-
73
-
74
-
75
-
76
-
77
-
78
-
79
-
80
-
81
-
82
-
83
-
84
-
85
-
86
-
87
-
88
-
89
-
90
-
91
-
92
-
93
-
94
-
95
-
96
-
97
-
98
-
99
-
100
-
101
-
102
-
103
-
104
-
105
-
106
-
107
-
108
-
109
-
110
-
111
-
 112
112 -
 113
113 -
 114
114 -
 115
115 -
 116
116 -
 117
117 -
 118
118 -
 119
119 -
 120
120 -
 121
121 -
 122
122 -
 123
123 -
 124
124 -
 125
125 -
 126
126 -
 127
127 -
 128
128 -
 129
129 -
 130
130 -
 131
131 -
 132
132 -
133
-
134
-
135
-
136
-
137
-
138
-
139
-
140
-
141
-
142
-
143
-
144
-
145
-
146
-
147
-
148
-
149
-
150
-
151
-
152
-
153
-
154
-
155
-
156
-
157
-
158
-
159
-
160
-
161
-
162
-
163
-
164
-
165
-
166
-
167
-
168
-
169
-
170
-
171
-
172
-
173
-
174
-
175
-
176
-
177
-
178
-
179
-
180
-
181
-
182
-
183
-
184
-
185
-
186
-
187
-
188
-
189
-
190
-
191
-
192
-
193
-
194
-
195
-
196
-
197
-
198
-
199
-
200
-
201
-
202
-
203
-
204
-
205
-
206
-
207
-
208
-
209
-
210
-
211
-
212
-
213
-
214
-
215
-
216
-
217
-
218
-
219
-
220
-
221
-
222
-
223
-
224
-
225
-
226
-
227
-
228
-
229
-
230
-
231
-
232
-
233
-
234
-
235
-
236
-
237
-
238
-
239
-
240
-
241
-
242
-
243
-
244
-
245
-
246
-
247
-
248
-
249
-
250
-
251
-
252
-
253
-
254
-
255
-
256
-
257
-
258
-
259
-
260
-
261
-
262
-
263
-
264
 |
 |

Table of Contents
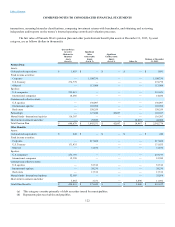
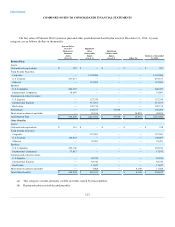
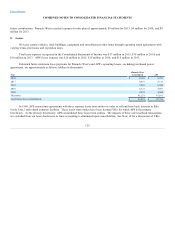
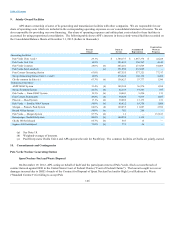
COMBINED NOTES TO CONSOLIDATED FINANCIAL STATEMENTS
Pinnacle West uses a December 31 measurement date each year for its pension and other postretirement benefit plans. The
market-related value of our plan assets is their fair value at the measurement date. See Note 13 for further discussion of how fair values
are determined. Due to subjective and complex judgments, which may be required in determining fair values, actual results could differ
from the results estimated through the application of these methods.
A significant portion of the changes in the actuarial gains and losses of our pension and postretirement plans is attributable to
APS and therefore is recoverable in rates. Accordingly, these changes are recorded as a regulatory asset or regulatory liability. In its
2009 retail rate case settlement, APS received approval to defer a portion of pension and other postretirement benefit cost increases
incurred in 2011 and 2012. We deferred pension and other postretirement benefit costs of approximately $14 million in 2012 and $11
million in 2011. Pursuant to an ACC regulatory order, we began amortizing the regulatory asset over three years beginning in
July 2012. We amortized approximately $5 million in 2015, $8 million in 2014, $8 million in 2013 and $4 million in 2012.
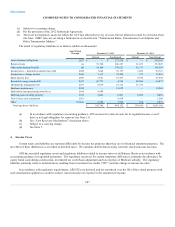
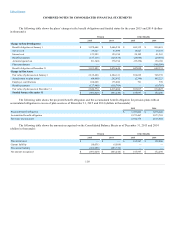
The following table provides details of the plans’ net periodic benefit costs and the portion of these costs charged to expense
(including administrative costs and excluding amounts capitalized as overhead construction, billed to electric plant participants or
charged to the regulatory asset or liability) (dollars in thousands):
Pension
Other Benefits
2015
2014
2013
2015
2014
2013
Service cost-benefits earned during the
period $ 59,627
$ 53,080
$ 64,195
$ 16,827
$ 18,139
$ 23,597
Interest cost on benefit obligation 123,983
129,194
112,392
28,102
41,243
41,536
Expected return on plan assets (179,231)
(158,998)
(146,333)
(36,855)
(46,400)
(45,717)
Amortization of:
Prior service cost (credit) 594
869
1,097
(37,968)
(9,626)
(179)
Net actuarial loss 31,056
10,963
39,852
4,881
1,175
11,310
Net periodic benefit cost $ 36,029
$ 35,108
$ 71,203
$ (25,013)
$ 4,531
$ 30,547
Portion of cost charged to expense $ 20,036
$ 21,985
$ 38,968
$ (10,391)
$ 6,000
$ 18,469
117