APS 2015 Annual Report Download - page 80
Download and view the complete annual report
Please find page 80 of the 2015 APS annual report below. You can navigate through the pages in the report by either clicking on the pages listed below, or by using the keyword search tool below to find specific information within the annual report.-
 1
1 -
2
-
3
-
4
-
5
-
6
-
7
-
8
-
9
-
10
-
11
-
12
-
13
-
14
-
15
-
16
-
17
-
18
-
19
-
20
-
21
-
22
-
23
-
24
-
25
-
26
-
27
-
28
-
29
-
30
-
31
-
32
-
33
-
34
-
35
-
36
-
37
-
38
-
39
-
40
-
41
-
42
-
43
-
44
-
45
-
46
-
47
-
48
-
49
-
50
-
51
-
52
-
53
-
54
-
55
-
56
-
57
-
58
-
59
-
60
-
61
-
62
-
63
-
64
-
65
-
66
-
67
-
68
-
69
-
 70
70 -
 71
71 -
 72
72 -
 73
73 -
 74
74 -
 75
75 -
 76
76 -
 77
77 -
 78
78 -
 79
79 -
 80
80 -
 81
81 -
 82
82 -
 83
83 -
 84
84 -
 85
85 -
 86
86 -
 87
87 -
 88
88 -
 89
89 -
 90
90 -
91
-
92
-
93
-
94
-
95
-
96
-
97
-
98
-
99
-
100
-
101
-
102
-
103
-
104
-
105
-
106
-
107
-
108
-
109
-
110
-
111
-
112
-
113
-
114
-
115
-
116
-
117
-
118
-
119
-
120
-
121
-
122
-
123
-
124
-
125
-
126
-
127
-
128
-
129
-
130
-
131
-
132
-
133
-
134
-
135
-
136
-
137
-
138
-
139
-
140
-
141
-
142
-
143
-
144
-
145
-
146
-
147
-
148
-
149
-
150
-
151
-
152
-
153
-
154
-
155
-
156
-
157
-
158
-
159
-
160
-
161
-
162
-
163
-
164
-
165
-
166
-
167
-
168
-
169
-
170
-
171
-
172
-
173
-
174
-
175
-
176
-
177
-
178
-
179
-
180
-
181
-
182
-
183
-
184
-
185
-
186
-
187
-
188
-
189
-
190
-
191
-
192
-
193
-
194
-
195
-
196
-
197
-
198
-
199
-
200
-
201
-
202
-
203
-
204
-
205
-
206
-
207
-
208
-
209
-
210
-
211
-
212
-
213
-
214
-
215
-
216
-
217
-
218
-
219
-
220
-
221
-
222
-
223
-
224
-
225
-
226
-
227
-
228
-
229
-
230
-
231
-
232
-
233
-
234
-
235
-
236
-
237
-
238
-
239
-
240
-
241
-
242
-
243
-
244
-
245
-
246
-
247
-
248
-
249
-
250
-
251
-
252
-
253
-
254
-
255
-
256
-
257
-
258
-
259
-
260
-
261
-
262
-
263
-
264
 |
 |

Table of Contents
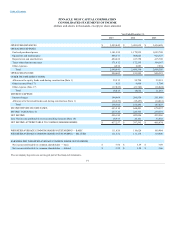
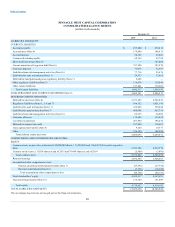
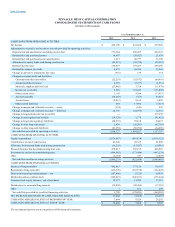
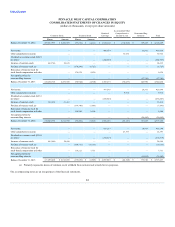
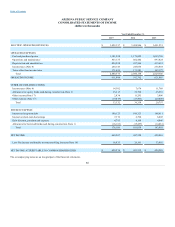
PINNACLE WEST CAPITAL CORPORATION
CONSOLIDATED STATEMENTS OF INCOME
(dollars and shares in thousands, except per share amounts)
Year Ended December 31,
2015
2014
2013
OPERATING REVENUES $ 3,495,443
$ 3,491,632
$ 3,454,628
OPERATING EXPENSES
Fuel and purchased power 1,101,298
1,179,829
1,095,709
Operations and maintenance 868,377
908,025
924,727
Depreciation and amortization 494,422
417,358
415,708
Taxes other than income taxes 171,812
172,295
164,167
Other expenses 4,932
2,883
7,994
Total 2,640,841
2,680,390
2,608,305
OPERATING INCOME 854,602
811,242
846,323
OTHER INCOME (DEDUCTIONS)
Allowance for equity funds used during construction (Note 1) 35,215
30,790
25,581
Other income (Note 17) 621
9,608
1,704
Other expense (Note 17) (17,823)
(21,746)
(16,024)
Total 18,013
18,652
11,261
INTEREST EXPENSE
Interest charges 194,964
200,950
201,888
Allowance for borrowed funds used during construction (Note 1) (16,259)
(15,457)
(14,861)
Total 178,705
185,493
187,027
INCOME BEFORE INCOME TAXES 693,910
644,401
670,557
INCOME TAXES (Note 4) 237,720
220,705
230,591
NET INCOME 456,190
423,696
439,966
Less: Net income attributable to noncontrolling interests (Note 18) 18,933
26,101
33,892
NET INCOME ATTRIBUTABLE TO COMMON SHAREHOLDERS $ 437,257
$ 397,595
$ 406,074
WEIGHTED-AVERAGE COMMON SHARES OUTSTANDING — BASIC 111,026
110,626
109,984
WEIGHTED-AVERAGE COMMON SHARES OUTSTANDING — DILUTED 111,552
111,178
110,806
EARNINGS PER WEIGHTED-AVERAGE COMMON SHARE OUTSTANDING
Net income attributable to common shareholders — basic $ 3.94
$ 3.59
$ 3.69
Net income attributable to common shareholders — diluted $ 3.92
$ 3.58
$ 3.66
The accompanying notes are an integral part of the financial statements.
77