APS 2015 Annual Report Download - page 111
Download and view the complete annual report
Please find page 111 of the 2015 APS annual report below. You can navigate through the pages in the report by either clicking on the pages listed below, or by using the keyword search tool below to find specific information within the annual report.-
 1
1 -
2
-
3
-
4
-
5
-
6
-
7
-
8
-
9
-
10
-
11
-
12
-
13
-
14
-
15
-
16
-
17
-
18
-
19
-
20
-
21
-
22
-
23
-
24
-
25
-
26
-
27
-
28
-
29
-
30
-
31
-
32
-
33
-
34
-
35
-
36
-
37
-
38
-
39
-
40
-
41
-
42
-
43
-
44
-
45
-
46
-
47
-
48
-
49
-
50
-
51
-
52
-
53
-
54
-
55
-
56
-
57
-
58
-
59
-
60
-
61
-
62
-
63
-
64
-
65
-
66
-
67
-
68
-
69
-
70
-
71
-
72
-
73
-
74
-
75
-
76
-
77
-
78
-
79
-
80
-
81
-
82
-
83
-
84
-
85
-
86
-
87
-
88
-
89
-
90
-
91
-
92
-
93
-
94
-
95
-
96
-
97
-
98
-
99
-
100
-
 101
101 -
 102
102 -
 103
103 -
 104
104 -
 105
105 -
 106
106 -
 107
107 -
 108
108 -
 109
109 -
 110
110 -
 111
111 -
 112
112 -
 113
113 -
 114
114 -
 115
115 -
 116
116 -
 117
117 -
 118
118 -
 119
119 -
 120
120 -
 121
121 -
122
-
123
-
124
-
125
-
126
-
127
-
128
-
129
-
130
-
131
-
132
-
133
-
134
-
135
-
136
-
137
-
138
-
139
-
140
-
141
-
142
-
143
-
144
-
145
-
146
-
147
-
148
-
149
-
150
-
151
-
152
-
153
-
154
-
155
-
156
-
157
-
158
-
159
-
160
-
161
-
162
-
163
-
164
-
165
-
166
-
167
-
168
-
169
-
170
-
171
-
172
-
173
-
174
-
175
-
176
-
177
-
178
-
179
-
180
-
181
-
182
-
183
-
184
-
185
-
186
-
187
-
188
-
189
-
190
-
191
-
192
-
193
-
194
-
195
-
196
-
197
-
198
-
199
-
200
-
201
-
202
-
203
-
204
-
205
-
206
-
207
-
208
-
209
-
210
-
211
-
212
-
213
-
214
-
215
-
216
-
217
-
218
-
219
-
220
-
221
-
222
-
223
-
224
-
225
-
226
-
227
-
228
-
229
-
230
-
231
-
232
-
233
-
234
-
235
-
236
-
237
-
238
-
239
-
240
-
241
-
242
-
243
-
244
-
245
-
246
-
247
-
248
-
249
-
250
-
251
-
252
-
253
-
254
-
255
-
256
-
257
-
258
-
259
-
260
-
261
-
262
-
263
-
264
 |
 |

Table of Contents
COMBINED NOTES TO CONSOLIDATED FINANCIAL STATEMENTS
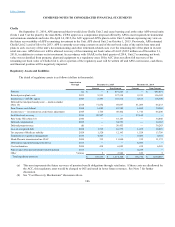
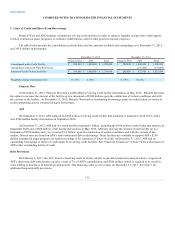
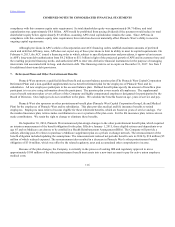
Cholla
On September 11, 2014, APS announced that it would close Cholla Unit 2 and cease burning coal at the other APS-owned units
(Units 1 and 3) at the plant by the mid-2020s, if EPA approves a compromise proposal offered by APS to meet required environmental
and emissions standards and rules. On April 14, 2015, the ACC approved APS's plan to retire Unit 2, without expressing any view on
the future recoverability of APS's remaining investment in the Unit. APS closed Unit 2 on October 1, 2015. Previously, APS estimated
Cholla Unit 2’s end of life to be 2033. APS is currently recovering a return on and of the net book value of the unit in base rates and
plans to seek recovery of the unit’s decommissioning and other retirement-related costs over the remaining life of the plant in its next
retail rate case. APS believes it will be allowed recovery of the remaining net book value of Unit 2 ($122 million as of December 31,
2015), in addition to a return on its investment. In accordance with GAAP, in the third quarter of 2014, Unit 2’s remaining net book
value was reclassified from property, plant and equipment to a regulatory asset. If the ACC does not allow full recovery of the
remaining net book value of Cholla Unit 2, all or a portion of the regulatory asset will be written off and APS’s net income, cash flows,
and financial position will be negatively impacted.
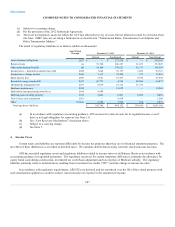
Regulatory Assets and Liabilities
The detail of regulatory assets is as follows (dollars in thousands):
Amortization
Through
December 31, 2015
December 31, 2014
Current
Non-Current
Current
Non-Current
Pension (a)
$ —
$ 619,223
$ —
$ 485,037
Retired power plant costs 2033
9,913
127,518
9,913
136,182
Income taxes - AFUDC equity 2045
5,495
133,712
4,813
118,396
Deferred fuel and purchased power — mark-to-market
(Note 16) 2018
71,852
69,697
51,209
46,233
Four Corners cost deferral 2024
6,689
63,582
6,689
70,565
Income taxes — investment tax credit basis adjustment 2045
1,766
48,462
1,716
46,200
Lost fixed cost recovery 2016
45,507
—
37,612
—
Palo Verde VIEs (Note 18) 2046
—
18,143
—
34,440
Deferred compensation 2036
—
34,751
—
34,162
Deferred property taxes (d)
—
50,453
—
30,283
Loss on reacquired debt 2034
1,515
16,375
1,435
16,410
Tax expense of Medicare subsidy 2024
1,520
12,163
1,528
13,756
Transmission vegetation management 2016
4,543
—
9,086
4,543
Mead-Phoenix transmission line CIAC 2050
332
11,040
332
11,372
Deferred fuel and purchased power (b) (c) 2015
—
—
6,926
—
Coal reclamation 2026
418
6,085
418
6,503
Pension and other postretirement benefits deferral 2015
—
—
4,238
—
Other Various
5
2,942
819
5
Total regulatory assets (e)
$ 149,555
$ 1,214,146
$ 136,734
$ 1,054,087
(a) This asset represents the future recovery of pension benefit obligations through retail rates. If these costs are disallowed by
the ACC, this regulatory asset would be charged to OCI and result in lower future revenues. See Note 7 for further
discussion.
(b) See “Cost Recovery Mechanisms” discussion above.
106